Difference between revisions of "IS484 AY2020/21 Term 1: MarTechX"
| Line 105: | Line 105: | ||
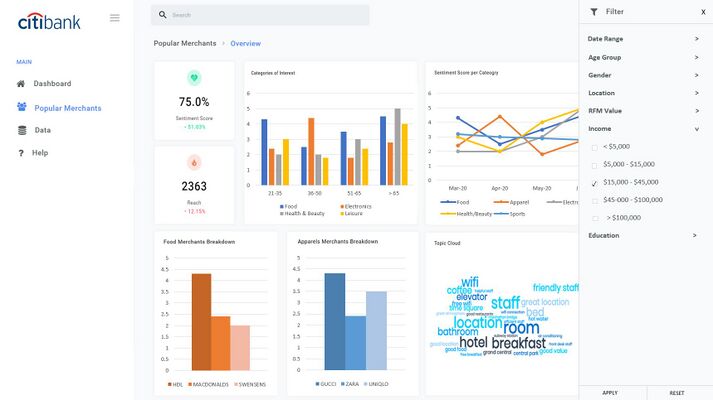
== Prototype User Interface == | == Prototype User Interface == | ||
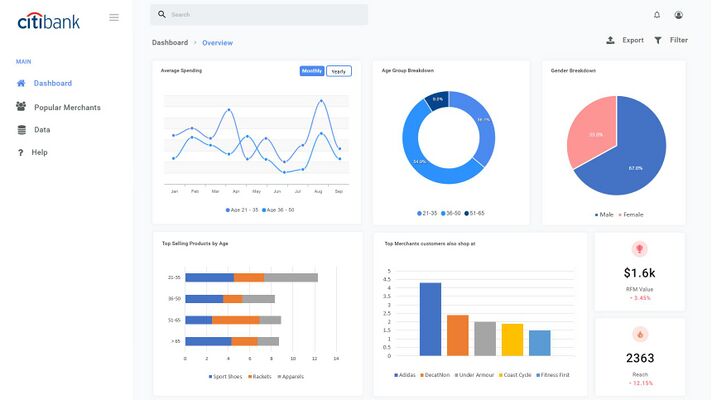
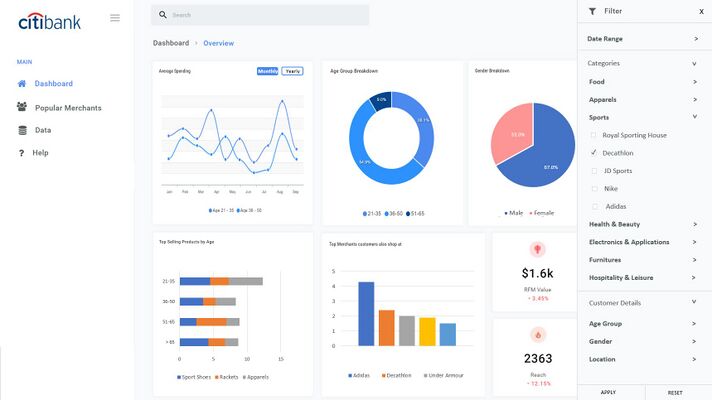
| − | [[File:Sample UI - Overview (1).jpg| | + | === Overview Dashboard === |
| − | [[File:Sample UI - Overview 2.jpg| | + | [[File:Sample UI - Overview (1).jpg|x400px|Caption]] |
| − | [[File:Sample UI - Popular Merchants (1).jpg| | + | [[File:Sample UI - Overview 2.jpg|x400px|Caption]] |
| − | [[File:Sample UI - Popular Merchants (2).jpg| | + | |
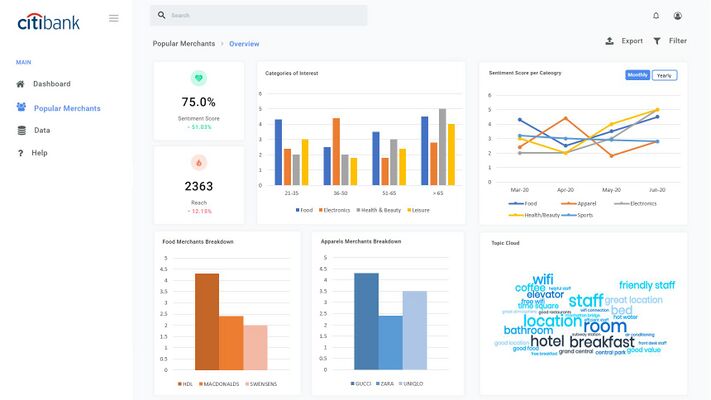
| + | === Popular Merchants Dashboard === | ||
| + | [[File:Sample UI - Popular Merchants (1).jpg|x400px|Caption]] | ||
| + | [[File:Sample UI - Popular Merchants (2).jpg|x400px|Caption]] | ||
Revision as of 17:08, 1 September 2020
“Our project aims to produce the best segmentation and recommendation for our client.”
Through this project, we aim to develop the best segmentation and recommendation for our client using an interactive visualization application as a base. With the power of our application, our customer will be able to take advantage of their data and increase customer satisfaction through more personalised marketing.
Contents
Project Overview
Motivation
In this digital age, a bank’s most valuable asset is its data, which provides insights into customer behavior, market trends and more. For a bank to grow (increase revenue), it must understand the needs and preferences of each customer, catering their strategies to each customer. This can be better done through improving their market segmentation strategies. Bank’s mass marketing strategy lacks personalisation and does not cater to each customer’s needs. According to a survey by NGDATA in 2016 on 300 Americans, only less than 30% think that offers from banks are customized to their individual needs 37% feel that they would be happier if the bank understood their needs. In fact, in another study conducted by Salesforce in 2018, 59% of global consumers (2655) feel tailored engagement based on past interaction is very important to winning their business.
Project Description
To increase the effectiveness of banks’ marketing strategy, our team introduces MarTechX, a web platform where CitiBank can better identify merchants to cooperate with for business opportunities and to better identify the segment of customer most receptive to the offers.
Merchant:
- The web application makes use of web scraping using twitter API based on the data provided to give a social/sentiment rating for each merchant. The social rating is then used to determine the more profitable merchants for business collaboration.
Customer:
- The web application makes use of machine learning algorithms such as regression and clustering analysis to better segment the customers according to their preferences rather than purely only traditional demographic and geographic approach.
The results would be displayed in the dashboard in the web application and a report can be generated.
Stakeholders
| Sponsor | User |
|---|---|
| Our Sponsor is from Citibank (CitiVentures Innovation Lab) and they are Yuqian Song (Head of APAC/EMEA Data Services and Head of Global Advanced Analytics Technology Solutions) and Ashish Awasthi (Citi Project Lead). Mr Ashish is our main contact person. | Our users will be the business owners of different departments at Citibank. |
Deliverables
Value Statement
“Our project aims to produce the best segmentation and recommendation for our client.”
Through this project, we aim to develop the best segmentation and recommendation for our client using an interactive visualization application as a base. With the power of our application, our customer will be able to take advantage of their data and increase customer satisfaction through more personalised marketing.
Scope
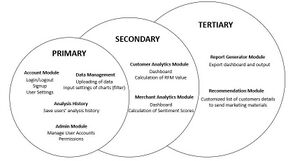
Users are able to sign in their account and choose whether they want to analyze the merchants or the customers side. They will then upload their data into the web application and set the settings of the charts (filters). They will be directed to the dashboard page to see the outcome of their data in charts. The dashboard will consist of the relevant charts and it is able to calculate the RFM Value for the customers and sentiment scores for the merchants. The dashboard page will also be to show the recommended action to take from the analysis and a list of customers details to send marketing materials. Users are able to download the list of suggested customers directly from the page. Lastly, users can choose to export the dashboard in a form of report for reporting and archival purposes.
Constraints
- Type of filters available on the dashboard depends on survey data gathered.
- Might not be able to collect enough data to conduct a comprehensive customer analysis.
Assumptions
- Chart Library is able to display dynamic data and generate reports
Project Plan
Risks
| No | Project Risk | Mitigation steps |
|---|---|---|
| 1. | Inadequate Data collection |
|
| 2. | Client/Sponsor pushes for earlier deadline |
|
| 3. | NDA Violation |
|
| 4. | Development tools may not work as expected |
|
| 5. | Missing data files |
|
Resource and Reference
| Programming Languages |
|
| Database |
|
| Framework |
|
| Version Control |
|
| APIs |
|
| Development Tools |
|
| Project Management |
|
