AY1516 T2 Team AP Analysis PostInterimTwitterFindings
| Data Retrieval & Manipulation (Pre Interim) | Pre interim findings | Post interim twitter findings | Post interim plan | Post interim findings |
|---|
High Level Twitter Data
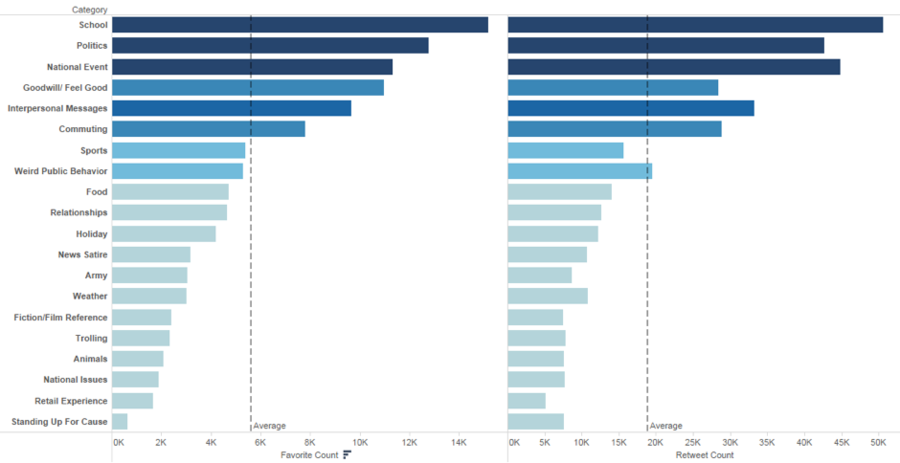
Retweet and Favorite count by Category: Top 5 Categories
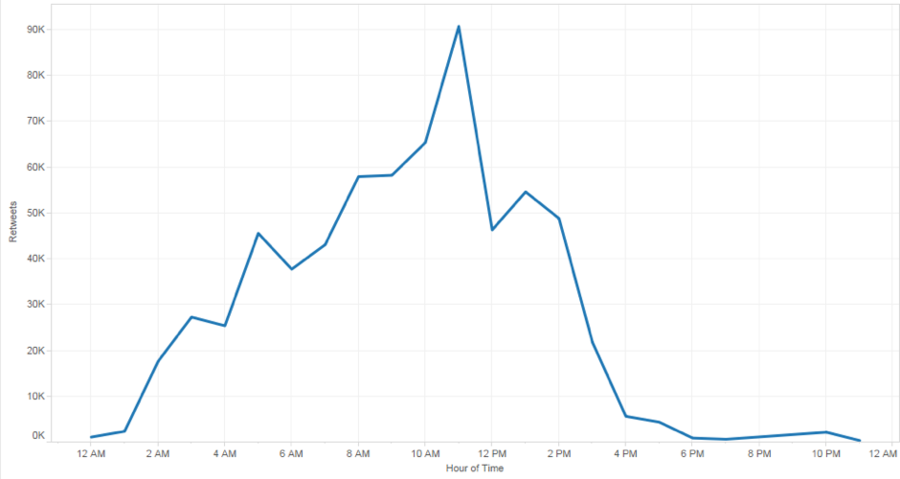
Retweet Behaviour
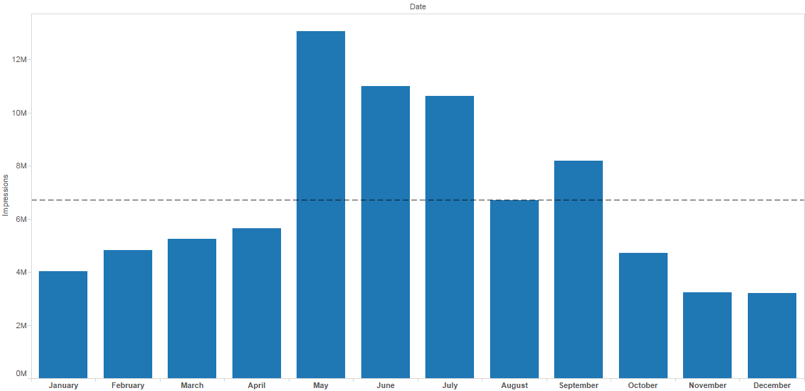
Impressions Behaviour
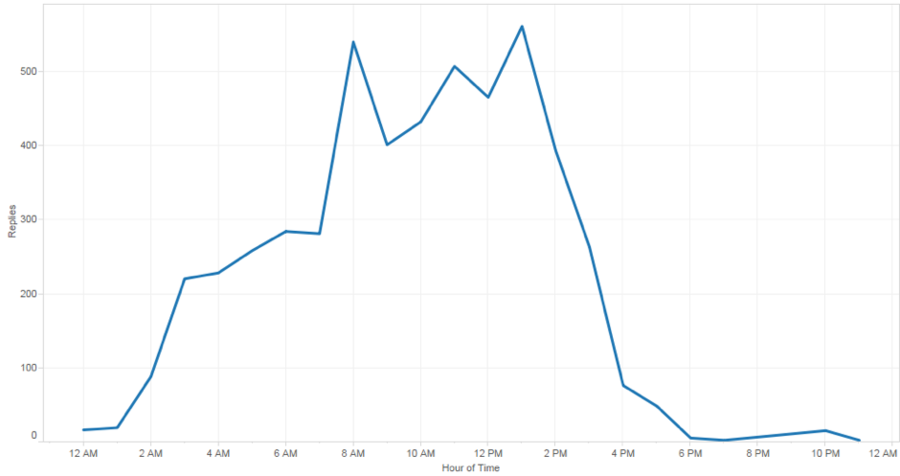
Replies Behaviour
Twitter Social Network – Post to User Engagement
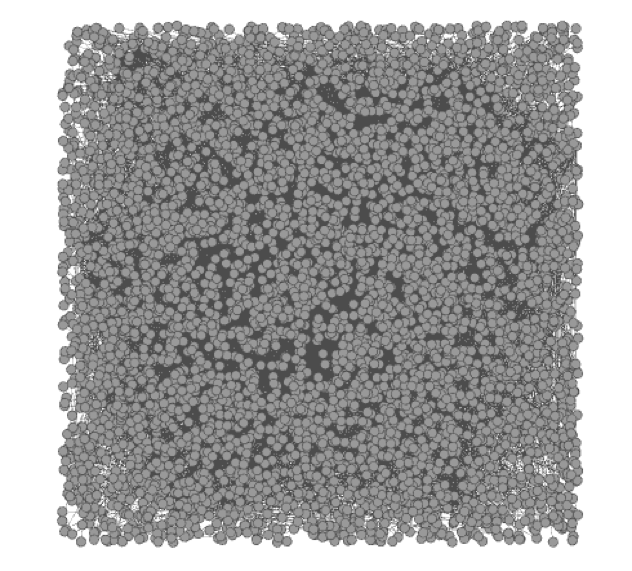
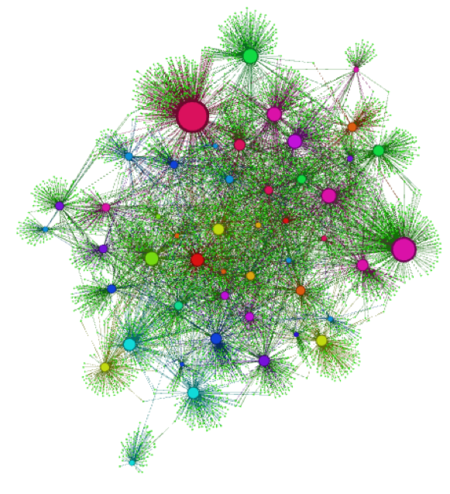
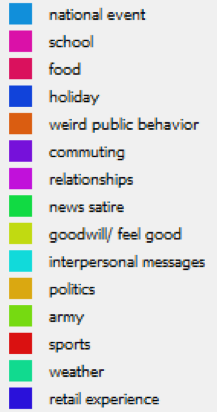
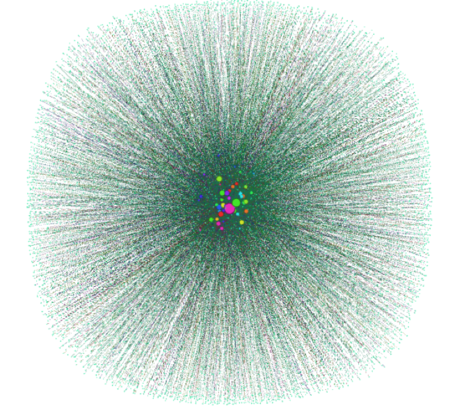
After conducting descriptive analysis on the high-level data extracted from SGAG’s Twitter account, we decided to create Gephi visualisations of SGAG’s Twitter social network. Using posts and followers as nodes, and each follower’s engagement (Retweet) as edges, this was the output generated.
Initial Gephi Output: Sample of 52 Twitter posts with more than 500 Retweets, Due to Twitter API limitations, we could only obtain 60 followers maximum per post.
Nodes: 5339 (52 post nodes, 5287 users) Edges: 7290
Based on the Gephi layout algorithms that emphasize complementaries, our team looked into 3 layouts to allow our visualisation to better resemble a social network: Force Atlas 2, YiFan Hu, Circular Layout. This serves to bring linked nodes together and push non-linked nodes apart to obtain a readable representation.
Force Atlas 2:
Frushterman-Reingold:
