ANLY482 AY2017-18T2 Group32 : Project Overview
| Description | Data | Methodology |
Contents
1.0 Project Motivation
With close to 100 brands of different medications under their belt and clients from the various medical sectors, it is an enormous challenge for anyone to monitor the performance of the sales of these products.
Our sponsor wishes to be able to view and analyze the performance of her sales teams in the form of a dashboard on Qlik Sense. It will be split into 2 different sections. One section of the visualization will be for sales representatives to see their account or brands and the invoices in 2015 to 2018. The other section will be for the business units directors and the sales managers in order to provide a succinct business report to upper management.
2.0 Business Problem
The business question that we were working on, monthly business review of the following:
1) How does the business perform?
- Did we meet our renewal target rate of 95%?
- New account acquisition target rate of 5%?
- Recover lost account target rate of 30% target?
3.0 Project Objective
Hence, this project aims to help the business better understand how the business has performed using an interactive data visualization dashboard.
This project aims to answer the "Who" and "What" - who shall be our main target audience for our sales efforts and what kind of drugs should we offer them?
The 3 different scenarios, namely:
- I. Renewal rate [% of customers who have remained from 2017]
- II. Acquisition rate [Amount$ sales value of newly acquired customers in the year 2018 who has never bought from Pharma G, as a % to total Amount$ sales value by all customers]
- III. Winning back lost accounts [Amount$ sales value of customers in the year 2018, who once bought in 2016 but not 2017]
We can see a relationship between each scenario and the brands of drugs sold that helps Pharmaceutical Company G achieves their respective targets. In each scenario, the brands of drugs and target audience will be different.
4.0 Scope of Work
Future Analysis:
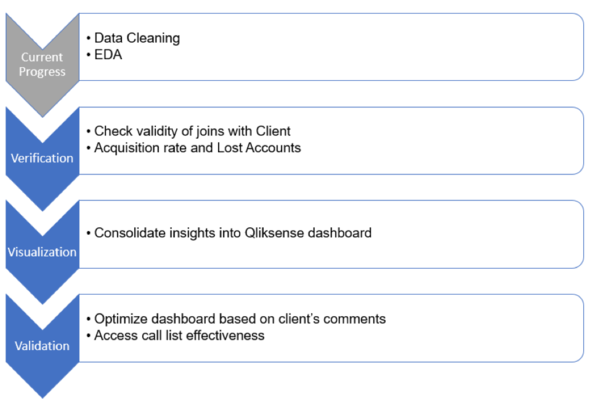
Before proceeding to the next KPI, it is vital that we verify with our client regarding the validity of our final dataset. Once we obtain the permission to continue, we will able to commence on the next steps of our project as depicted in the chart below.

