Kiva Project Findings
| Interim | Final |
|---|
Contents
- 1 Data Cleaning
- 2 Data Preperation
- 3 Exploratory Data Analysis
- 3.1 Overview of Number of Loans & Loan Amount
- 3.2 Monthly Trend of Number of Loans
- 3.3 Overview of Number of Loans & Median Loan Amount
- 3.4 Distribution of Loans by Repayment Period and Type
- 3.5 Distribution of Field Partners and Loans by Country
- 3.6 Distribution of Duration of Disbursement by Country
- 3.7 Distribution of Not Fully Funded Loans and Loan Amount
- 3.8 Distribution of Loans by Gender and Sector
Data Cleaning
Missing Value

Figure 1: Screenshot of loan_themes_by_region.csv
The screenshot above of loan_themes_by_region.csv shows a snippet of the old geocode of the Kiva regions having many missing values (14536 out of 15736 records). As there is far too many missing records for this column to derive any meaningful information regarding shifts in location regions for particular loan themes, we removed this column entirely.

Figure 2: Screenshot of kiva_mpi_region_locations
The table above shows the erroneous records of kiva_mpi_region_locations, where there is no location name (which is the main identifier/primary key for this table) and missing values of all other columns except the geocode, which only consists of (1000.0,1000.0) values and are not actual geocodes. Hence, all of these 1788 rows which had no useful information were removed.
Redundant data
There are were some data which we removed as they were either repeated information from other columns or were erroneous. In the file kiva_mpi_region_locations.csv, there was a column geo which was an addition of both latitude and longitude. As the individual columns were more useful for our analysis, we hence removed the geo column.

Figure 3: Screenshot of kiva_mpi_region_locations.csv with geo column having duplicate information
Lastly, we removed a single invalid record from kiva_loans.csv, where the funded time was after the posted time, which should never be the case as the loan should not be funded even before it was posted.
![]()
Figure 4: Screenshot of the invalid record in kiva_loans.csv
Date Merging
To find the relationship between the variables provided by the different files, we first did a left outer join of kiva_loans.csv and loan_theme_ids.csv. The reason for this is that loan_theme_ids itself does not provide much information with just the loan theme id and type, and to utilise the variables in loan_theme_by_region, we require information from both loan_theme_id.csv and kiva_loans.csv. Thereafter, we again did left outer join with the remaining 2 files, kiva_mpi_region_locations and loan_themes_by_region to get the other variables while preserving all the records in kiva_loans.
Data Preperation
Borrower’s gender
In kiva_loans.csv, the genders of borrowers are being aggregated into a single borrower_genders column as shown in the table below. For example, the first record has 2 borrowers, both of whom are female.

Figure 5: Screenshot of borrower_genders in kiva_loans.csv containing multiple gender counts, 1 for each borrower of the loan record
There were a few kinds of meaningful information to be obtained from this column. We split the column up by the comma delimiter, to obtain the gender of the loan’s primary borrower as well as the count of male, female and total number of borrowers.
We also obtained the duration of funding by getting the difference between the funded time and posted time.
Tags
Similarly, in kiva_loans.csv, all of the tags are contained in a single column, and columns may contain multiple tags. In some cases, there is repetition of the same tag which we have to account for and treat it as a single tag.

Figure 6: Screenshot of tags column in kiva_loans.csv, highlighting each record containing multiple tags and unnecessary repeated tags for a single record
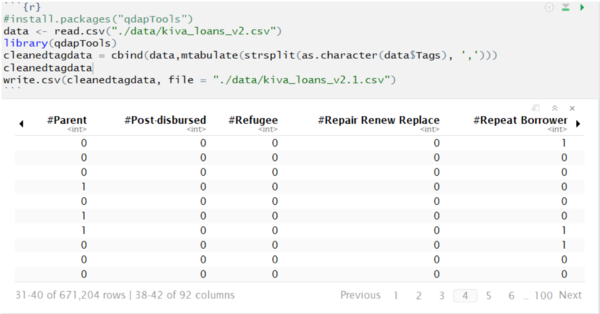
Figure 7: Screenshot of R code used to split the tag column up into individual tags with dummy variables.
As shown in the screenshot above, we used R code and split the tag column up into individual tags, each being a dummy/binary variable to indicate if the loan record contains this tag or not. From there, we will then be able to visualize how the type of tag is related to the loan amount and funding.
Region
Currently, the only meaningful data for geographical locations are the country and world_region (which represents continent or subcontinent). The existing region column is highly inaccurate as it does not meaningfully show the different level of administrative regions. For the countries with larger records such as Philippines and Kenya, we retrieved the data from GADM, the Database of Global Administrative Areas, and will map the record of each region to the respective three levels of administrative regions. This allows us to conduct more in-depth and meaningful analysis, as cultures, practices and welfare levels vary greatly across different regions in huge countries, such as Philippines which accounts for the largest number of loans in the data. (Our team is still in the midst of mapping the data records to the fields from the GADM file.)
New Variable Creation
We created the following variables for the exploratory analysis.
1. Duration of funding: the difference between the funded time and posted time.
2. Duration of disbursement: the difference between the posted time and disbursed time.
3. Total unfunded amount: the difference between the total loan amount and the total funded amount.
4. Number of borrowers using Tableau code: LEN([Borrower Gender])-LEN(REPLACE([Borrower Gender],’,’,’’))+1
Exploratory Data Analysis
Overview of Number of Loans & Loan Amount
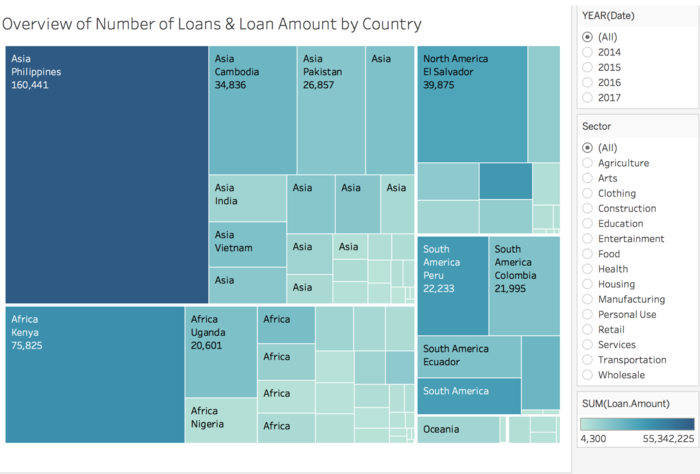
Figure 8: Overview of Number of Loans & Loan Amount by Continent by Country
In the graph above, we conduct exploratory data analysis on how the loan amount differs across different countries. Each block represents a single country, with the size of square representing the total number of loans for that country and the shade of the color represents the total loan amount. As shown from the size of the squares, the loan records are largely from Asia and Africa. Philippines and Kenya are the top 2 countries with the largest number loan records and and largest loan amounts.
Next, we analyzed how the trends of loan amount and quantity changed over time across different countries. The whole dataset contains records from 1st January 2014 to 26th July 2017, we analyzed the change on both yearly and monthly basis. However, as there are only records for the first half of the year in 2017, we excluded 2017 from the yearly trends. Similarly, the records in July 2017 are incomplete and we excluded this month for our monthly analysis.
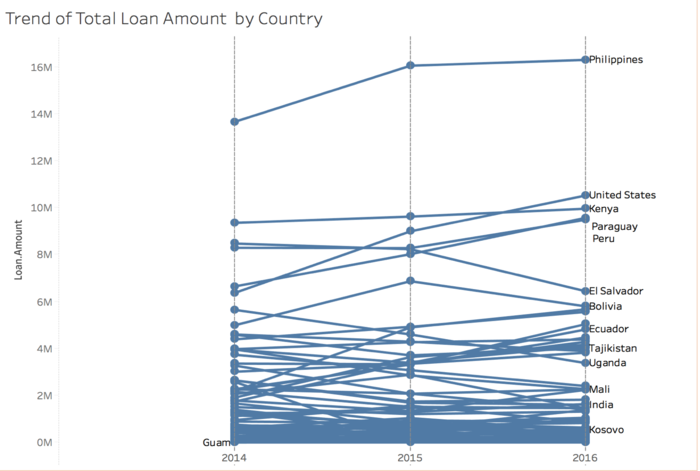
Figure 9: Yearly Trend of Total Loan Amount
According to the chart above, Philippines is the country with the largest total loan amount. We also observed a significant increasing trend in the United States. Interestingly, although the number of records in United States is relatively small based on the treemap in Figure 8, its total loan amount outnumber Kenya in 2016.
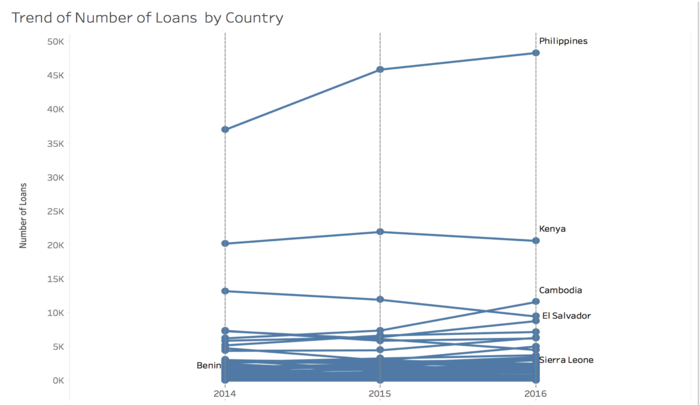
Figure 10: Yearly Trend of Number of Loans
From the figure above, Philippines has always had the greatest amount of records and it is still increasing over the years. El Salvador was the third country which has the greatest records in 2014 but it has been constantly decreasing. On the contrary, the number of loan records is rising in Cambodia and it surpassed El Salvador in 2016 as having the third largest number of loans.
Monthly Trend of Number of Loans
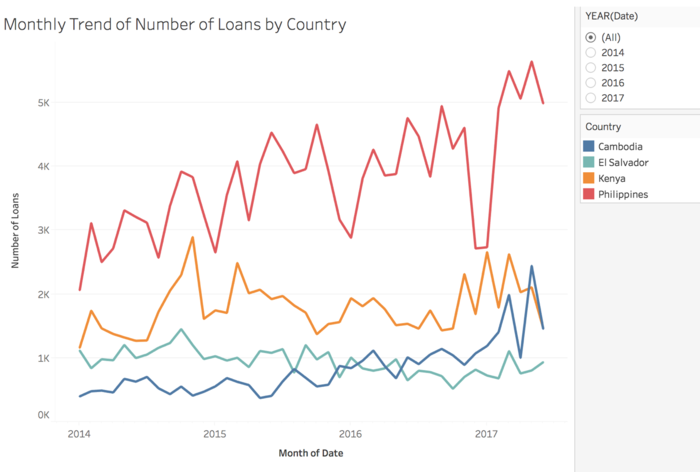
Figure 11: Monthly Trend of Number of Loans by Sector
We then plotted the monthly trend of total number of loans for Philippines, El Salvador, Kenya and Cambodia as they are countries with the largest number of loans. The above figure indicates a larger range of fluctuation of loans in Philippines compared to the other 3 countries.
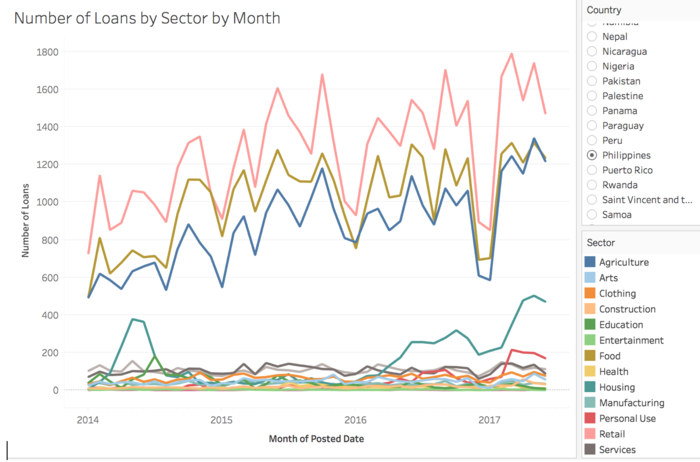
Figure 12: Monthly Trend of Number of Loans by Sector in Philippines
For further investigation, we broke down the number of loans by different sector for Philippines. The above figure indicates that the top 3 sectors with the largest number of loans in the Philippines are “Retail”, “Food” and “Agriculture”. The fluctuation of these 3 sectors is relatively large and follow the similar pattern.
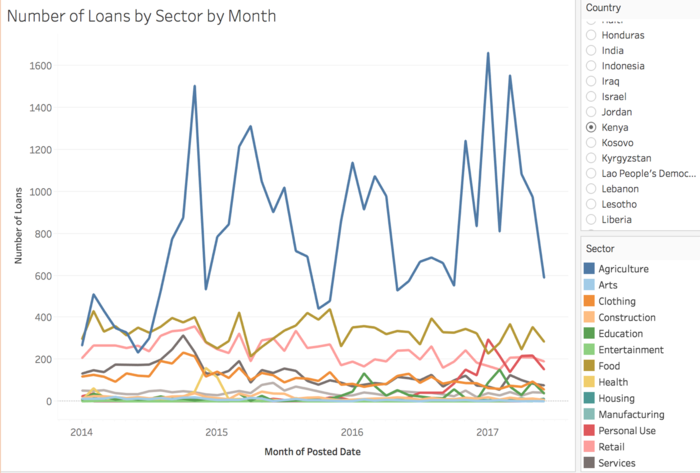
Figure 13: Monthly Trend of Number of Loans by Sector in Kenya

Figure 14: Monthly Trend of Number of Loans by Sector in Cambodia
However, in Kenya and Cambodia the distribution is very different compared to Philippines. The dominant sector in Kenya has consistently been only “Agriculture”. In Cambodia, “Agriculture” was mildly higher than the other sectors but there was no obvious dominating sector, and over time “Personal Use” gradually increased whereas “Agriculture” rapidly spiked in 2017.
Overview of Number of Loans & Median Loan Amount

Figure 15: Overview of Number of Loans & Median Loan Amount by Sector
We were also interested in the distribution of the loan across different sector and activity. In the graph above, the size of block represents the total number of records and the color represents the median loan amount. Majority of the loan records are for “Agriculture”, “Food” and “Retail” sectors. However, the median of loan amount for “Education”, “Health”, “Construction”, “Wholesale” and “Entertainment” are the greatest among all the loan sectors, while these sectors do not have significant number of loans.
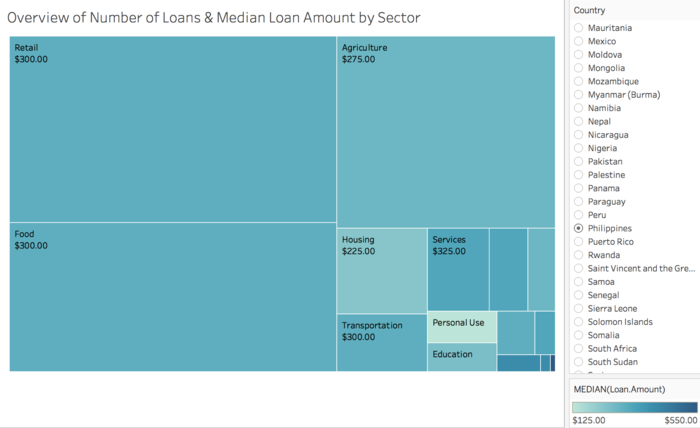
Figure 16: Overview of Number of Loans & Median Loan Amount by Sector in Philippines
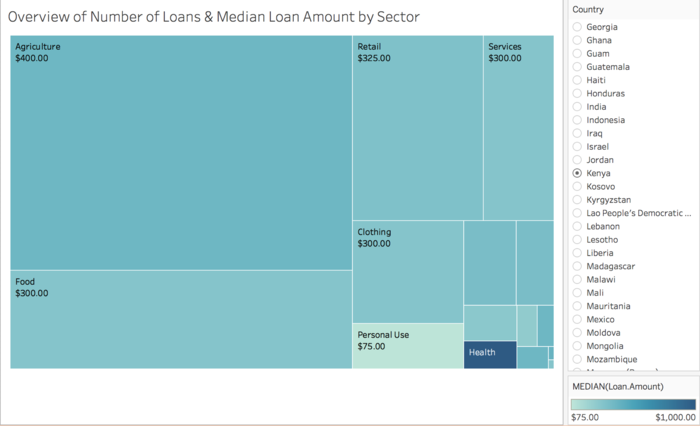
Figure 17: Overview of Number of Loans & Median Loan Amount by Sector in Kenya
The above two figures show the breakdown of the loan distribution for different sectors in Philippines and Kenya. In both countries, the “Personal Use” sector has a significantly smaller median loan amount compared to other sectors. In Philippines, the median loan amount is relatively homogeneous across all sectors, but in Kenya the “Health” sector has a much larger median loan amount compared to the others.
Distribution of Loans by Repayment Period and Type
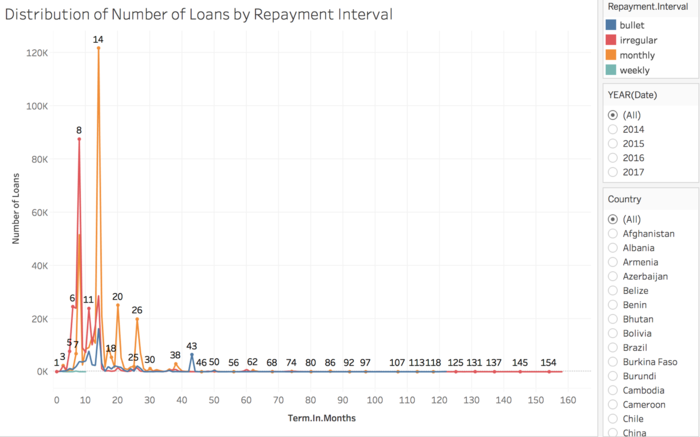
Figure 18: Overview Distribution of Loans by Repayment Period and Type
We were interested in finding out how long it usually takes for a borrower to repay, as well as the distribution of repayment interval types in different countries. In the data, there are four unique types of repayment intervals - ‘Bullet’, ‘Irregular’, ‘Monthly’ and ‘Weekly’. ‘Bullet’ repayment refers to a lump sum payment of the loan for the entirety of the loan amount paid at maturity (end of the loan).
The above figure shows the global distribution of repayment period (‘Term In Months’) of different repayment types (‘Repayment Interval’) for the four years. The distribution of repayment period for irregular and monthly repayment is highly skewed to the right, meaning that most loans have shorter loan term compared to the entire range of values. Most of the irregular repayment loans has repayment period of 8 months and most of the monthly repayment loans has repayment period of 14 months. The number of weekly repayment loans is quite small and the repayment period is no longer than 10 months. Also, the few loans that have relatively extremely long repayment period (more than 125 months) all belong to the irregular repayment type.
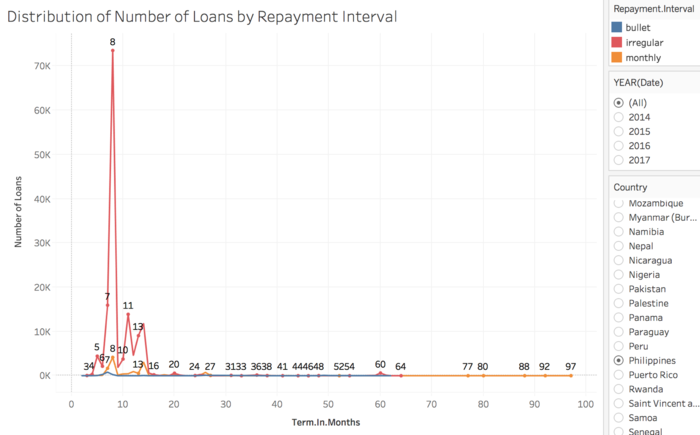
Figure 19: Distribution of Loans by Repayment Period and Type - Philippines
In Philippines, most of the loans belong to irregular repayment interval type and there is no weekly repayment interval. The irregular repayment interval loans with a repayment period of 8 months dominates the country. There are few monthly repayment loans with relatively extremely long (longer than 70 months) repayment period.
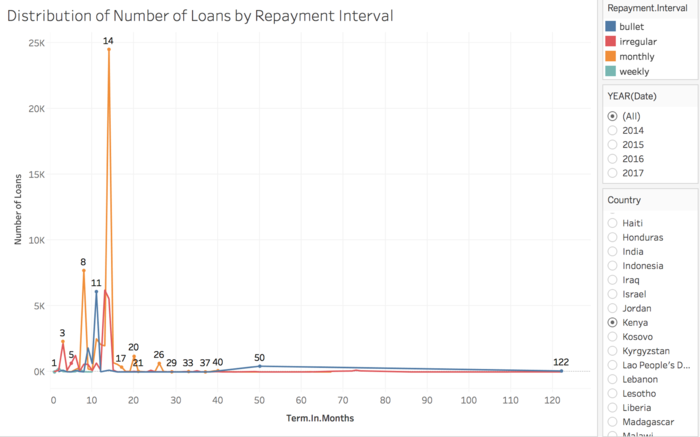
Figure 20: Distribution of Loans by Repayment Period and Type - Kenya
In Kenya, monthly repayment loans with repayment period of 14 months and 8 months dominate the country. There are also a few number of loans in bullet and irregular repayment type. Unlike Philippines, there are a few bullet and irregular repayment loans with a relatively long (longer than 70 months) repayment period.
Distribution of Field Partners and Loans by Country
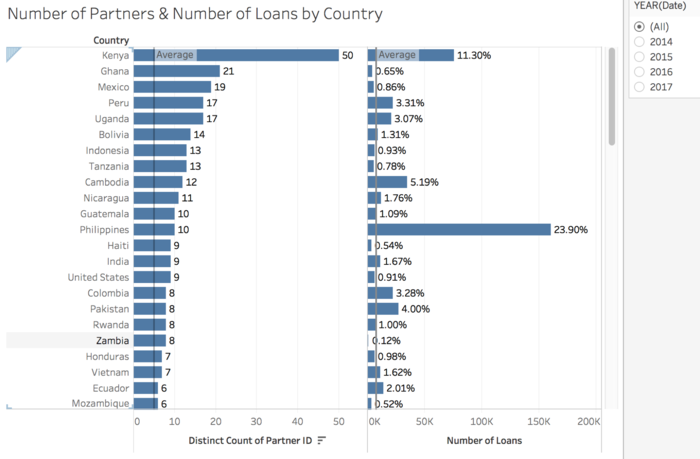
Figure 21: Overview Distribution of Field Partners and Loans by Country
Kiva’s partnership with local organizations (Field Partners) is key its success to date. The partnership enables Kiva to reach out to more borrowers and even in the most remote places in the world. These local organizations work in communities to provide services, vet borrowers and administer loans.
We were interested to find out the distribution of number of field partners in different countries. The above side-by-side bar chart shows the number of field partners and number of loans in all countries for the 4 years, and it is sorted by the number of field partners in descending order. It shows that Kenya has the largest number of field partners, followed by Ghana and Mexico. However, the number of loans of Ghana and Mexico are below the average number of loans over the world despite having many field partners. In addition, Philippines has the largest number of loans, which is even larger than the double the number of loans in Kenya despite having only 10 field partners, comparing to 50 field partners in Kenya.
Distribution of Duration of Disbursement by Country

Figure 22: Overview Distribution of Duration of Disbursement by Country
We are interested in finding out how long it usually takes for a borrower to receive the loan after fundraising on Kiva in different countries. Duration of disbursement is calculated as the difference between the posted time and the disbursed time. The above box-plot shows the distribution of duration of disbursement of different countries for the 4 years. Surprisingly, most of the countries have negative median duration of disbursement, which shows that most of the loans are disbursed to the borrowers before being posted on Kiva. It discloses the general business model of Kiva and field partners in most countries, where the field partner disburses the loan to borrowers before the loan request is actually posted on Kiva for fundraising.
Distribution of Not Fully Funded Loans and Loan Amount
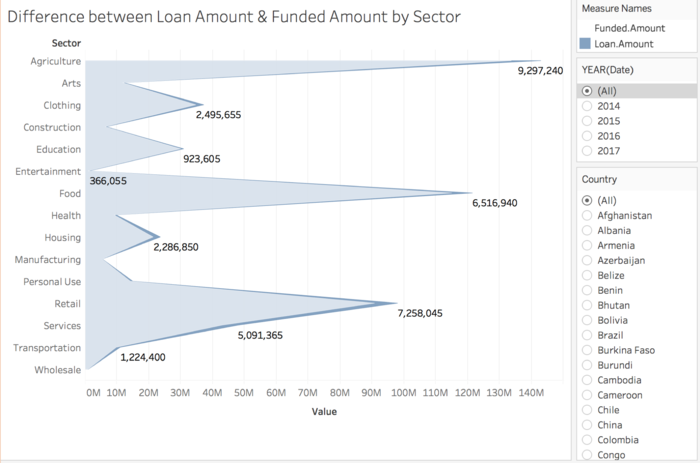
Figure 23: Overview Distribution of Difference between Loan Amount and Funded Amount by Sector
Figure 23 shows the global overview of the total unfunded amount in different sectors for all 4 years. The total unfunded amount is calculated as the difference between total loan amount and total funded amount.The dark blue shaded area represents the total unfunded amount. The larger the shadow area, the larger the total unfunded amount. We can see that not all borrowers of Kiva could raise the full loan amount as they posted. ‘Agriculture’ sector has the largest total unfunded amount of $9,297,240 USD over the world, followed by ‘Retail’ and ‘Food’ sector.
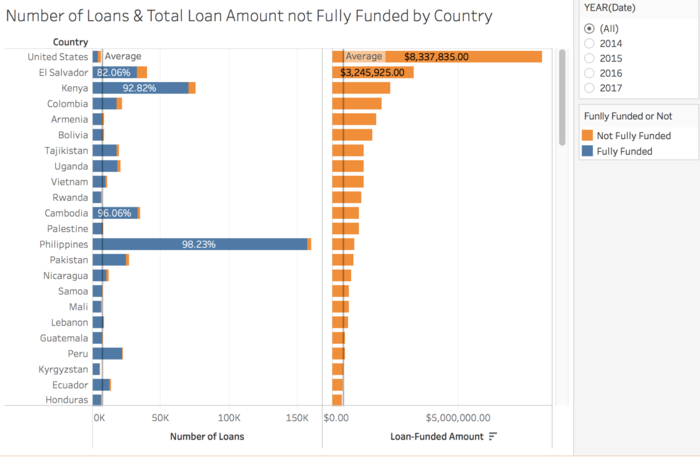
Figure 24: Distribution of Loans and Difference between Loan Amount and Funded Amount by Country
To find out the distribution of loans that are not fully funded by country, we categorise the loans into 2 groups. If the funded amount is less than the target amount (loan amount), the loan is categorised as ‘Not Fully Funded’; otherwise, it is categorised as ‘Fully Funded’. The above side-by-side bar chart shows the total number of ‘Fully Funded’ (in blue) and ‘Not Fully Funded’ (in orange) loans and the total unfunded amount of all countries for the 4 years and it is sorted by the total unfunded amount in descending order. We can see that United States has the largest total unfunded amount, followed by El Salvador and Kenya. It also shows that El Salvador has the largest number of not fully funded loans, followed by Kenya and Colombia.
To further find out the distribution of not fully funded loans for different purposes of use (‘Sector’ and ‘Activity’) by country, we built the following treemap below and specifically look at the top 3 countries, United States, El Salvador and Kenya, which has the largest total unfunded amount.
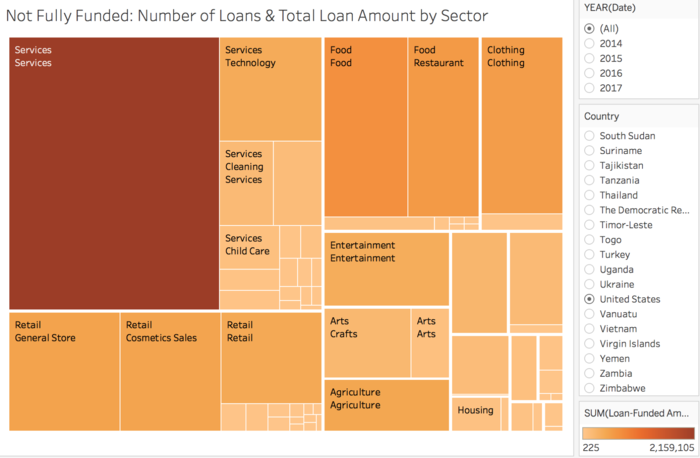
Figure 25: Distribution of Not Fully Funded Loans and Loan Amount by Sector by Activity - United States
Fully funded loans are filtered out for the treemap as it only focuses on the loans that are not fully funded . The treemap shows the distribution of not fully funded loans in different purposes of use (‘Sector’ and ‘Activity’). The area size of each rectangle shows the total number of not fully funded loans of an activity within a sector. The color represents the total unfunded amount. The darker the color, the larger the total unfunded amount.
The above treemap shows that most of the not fully funded loans in United States falls in the ‘Services’ sector and activity. It also has the largest total unfunded amount, followed by the ‘Food’ sector and activity.
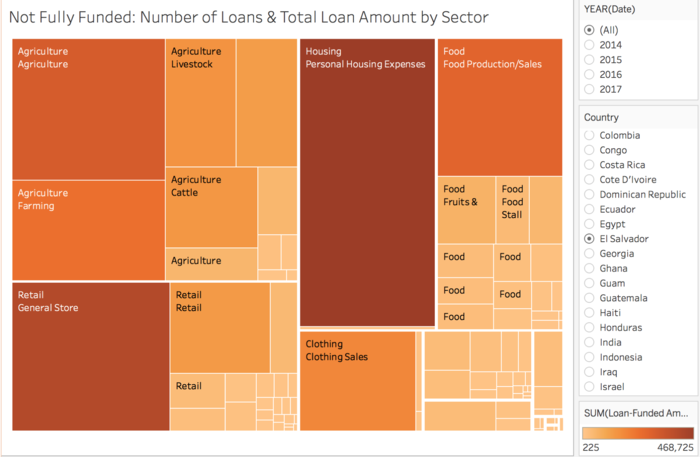
Figure 26: Distribution of Not Fully Funded Loans and Loan Amount by Sector by Activity - El Salvador
The above treemap shows that in El Salvador, the country with the largest number of not fully funded loans falls in the ‘Agriculture’ sector, followed by ‘Retail’ and ‘Housing’ sector. Besides, the largest total loan amount of not fully funded loans falls under ‘Personal Housing Expenses’ activity within the ‘Housing’ sector, followed by the ‘General Store’ activity under the ‘Retail’ sector.
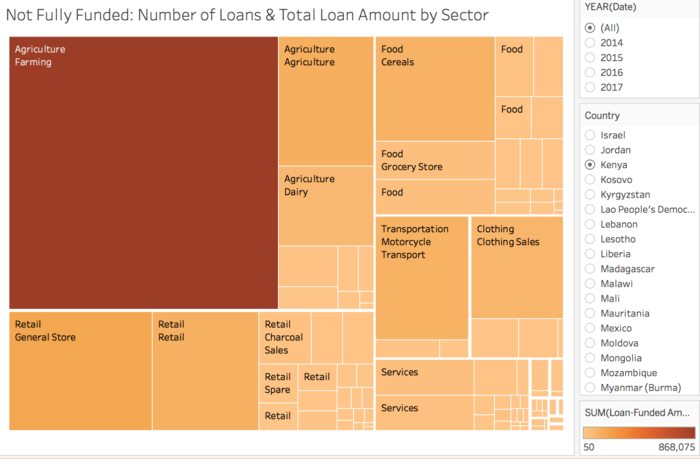
Figure 27: Distribution of Not Fully Funded Loans and Loan Amount by Sector by Activity - Kenya
In Kenya, we can see that the largest total number of not fully funded loans falls under the ‘Agriculture’ sector, followed by ‘Retail’ and ‘Food’ sector. ‘Farming’ activity in ‘Agriculture’ sector has the largest total unfunded amount, followed by ‘General Store’ activity in ‘Retail’ sector.
Distribution of Loans by Gender and Sector
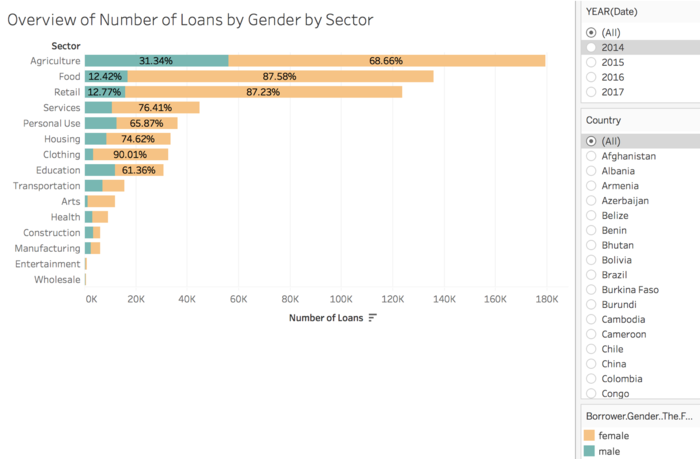
Figure 28: Distribution of Loans by Gender by Sector
We were also interested in how the loans are distributed by gender and sector. The bar chart above shows the distribution of loans by gender and sector across the world for the 4 years. Most of the borrowers are female, and most of the male borrowers fundraise in the sectors of ‘Agriculture’, followed by ‘Retail’ and ‘Food’. The clothing sector has the largest percentage of female borrowers comparing to the male borrowers, comprising 90.01% of the borrowers for this sector.
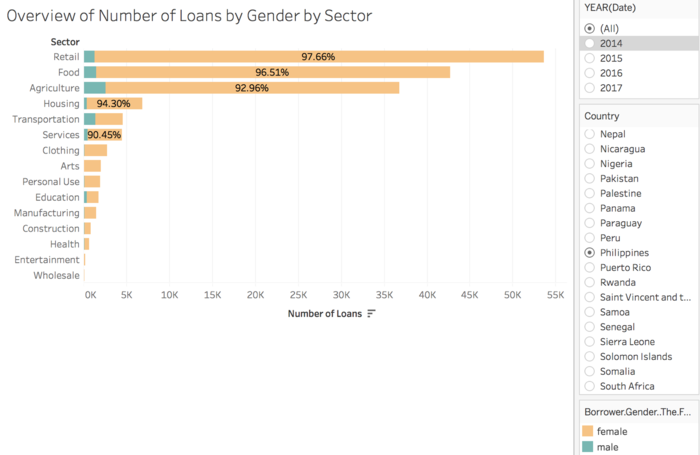
Figure 29: Distribution of Loans by Gender by Sector - Philippines
Whereas, in Philippines, female borrowers dominate in the country with only a small percentage of male borrowers. Amongst the top 3 sectors with the most loans, the retail sector has the largest percentage of female borrowers comparing to that of male borrowers with a value of 97.66%, followed by food sector of 96.51% and housing sector of 94.30%.
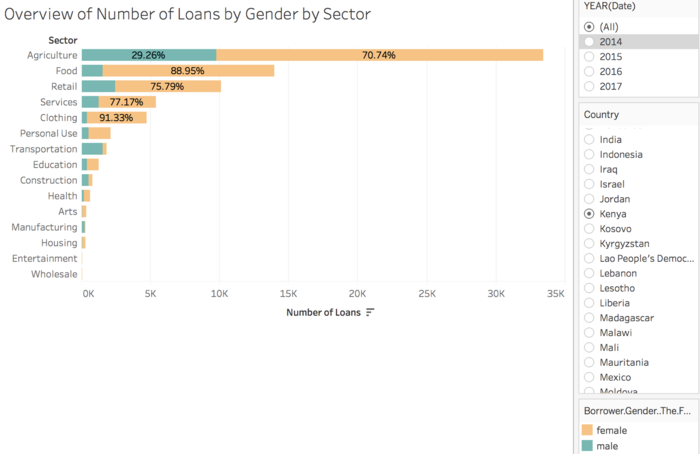
Figure 30: Distribution of Loans by Gender by Sector - Kenya
In Kenya, the percentage of male borrowers is larger than the percentage of male borrowers in Philippines, although there are still much more female borrowers than male borrowers. In the clothing sector, 91.33% of the borrowers are female, followed by 88.95% in the food sector and 77.17% in the retail sector.