G7 Exploratory Analysis
Note: Due to the confidential nature of our project, we will not be able to reveal all the missing values/fields on this wiki.
Business Unit Exploration
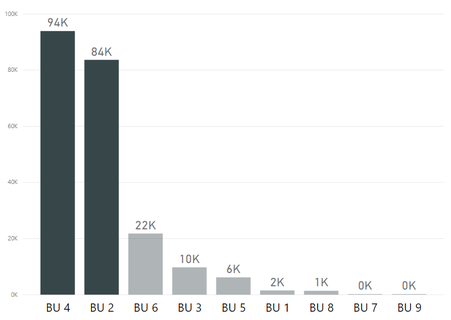
We wanted to identify the major Business Units in our dataset. BU 4 was the top business unit in terms of number of shipments for the years 2015 & 2016 and ranked second in 2017 accounting for 43.02% of the total shipments in the data. BU 2 ranked second for the years 2015 & 2016 and ranked first for the year 2017 accounting for 28.33% of the total shipments in the data.
Current Operational Performance
Next, we wanted to get a glimpse of the current operational performance across the 3 years. The following table shows that 40% of the shipments were delayed in our dataset and the performance does not vary much across the 3 years.
Operational Performance/BUs
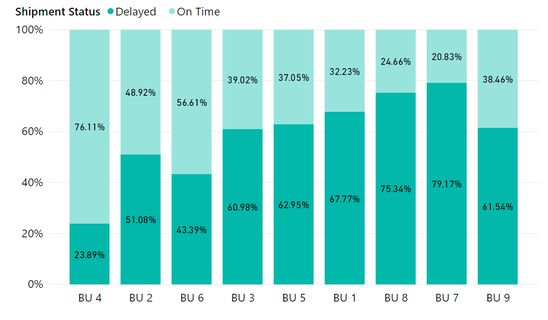
Next, we wanted to check the difference in the operational performance across different business units. The above chart does show a very different performance for different Business units but we will have to conduct statistical tests to confirm our hypothesis which is further covered under the Confirmatory Analysis section.
Operational Performance/Flight Types


