ANLY482 AY2017-18 T2 Group 31 Model Buidling and Analysis
Model Building
Modified L Test via Ripley's K Function
To determine:
1. If the notifications appear to be clustered or randomly distributed in our area of interest
2. Minimum radius distance which shows signs of statistically significant clustering
Number of observed notifications is compared to the number of notifications expected based on Complete Spatial Randomness (CSR)
CSR assumes distribution of points is homogeneous over the study area
Null hypothesis: the spatial points are randomly distributed, using alpha = 0.01
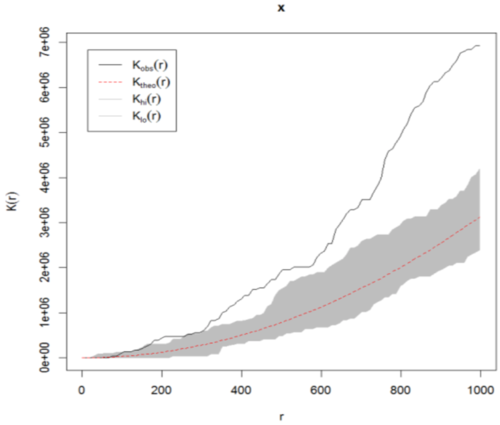
Bold line represents the observed values for a range of 𝑟
Red dotted line represents the expected theoretical value for a range of 𝑟
Grey area is the confidence envelope obtained through 100 iterations of Monte Carlo procedures based on assumptions from CSR
For each simulated point pattern, 𝐾(𝑟) is estimated over a range of 𝑟. The max and min of these functions define an upper and lower simulation of the envelope
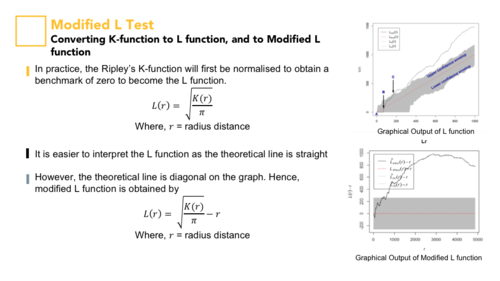
Converting K-function to L function, and to Modified L function


