ANLY482 AY2017-18T2 Group02 Findings & Insights
| Home | Project Overview | Findings & Insights | Documentation | Project Management | Back to project list |
Thesis
Thesis — Algorithm-driven architectural design and procedural generation of 3D digital environments were the inspiration for the lofty initial goal of this project: to perform, aid, or serve to validate structural engineering design for underground train stations. On the premise that geological features were likely to be primary considerations, we hoped to build a predictive model to accomplish this. However, through further dialogue with the engineers, and examination of the geological data, it’s become clear that much of the structural design is not related to geological features; rather, there are other more significant hidden variables influencing design.
Limiting factors — Soil stratum data from borehole excavation serves as an informing factor to engineers designing retaining and load-bearing walls for stations, but the relationship between strata and design parameters remains obscure as a form of domain knowledge. Further insight into what considerations are made by engineers when looking over geological data is necessary, and additional data on the relationship between boreholes and station design features, i.e. walls, would be necessary to move toward predictive capability.
Reframing goals and the pathways to them — Given the limited predictive capacity of just borehole data, we will instead seek to build better understanding of the geological information through visualization, for the sake of future predictive efforts.
Data Preparation and Exploration
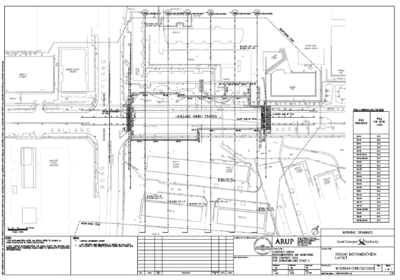
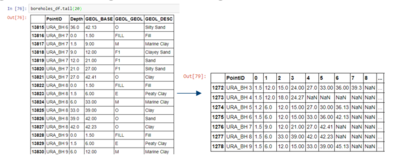
Data sources — We have two key data sets from the sponsor: A Microsoft Access file containing information on the geological properties of boreholes, as well as their locations; and a set of engineering drawings comprising 5 stations of Downtown Line 3, including reference tables to boreholes and the corresponding engineering design features.Pivot table — The first thing we needed to do was to pivot the borehole data such that stratum data is grouped by borehole, instead of stratum. Each borehole had different depths and number of strata, presumably dug and measured based on the surveyor’s insights on what is necessary for the project and possible on the site.
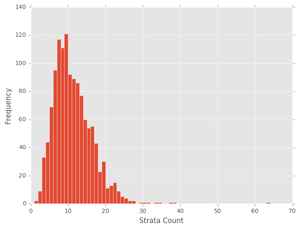
What’s immediately observable is that there are a few outlier (n=8) boreholes with unusually many strata identified, especially one with 64 strata. This drastically increases the number of features after pivoting, especially after including not only the baseline of each strata, but also the soil type. The feature space of the pivoted table is also consequentially considerably more sparse than the original ungrouped table. When attempting to build a predictive model in the future, the sparse matrix must be taken into consideration when selecting both the model and the implementation of the model.
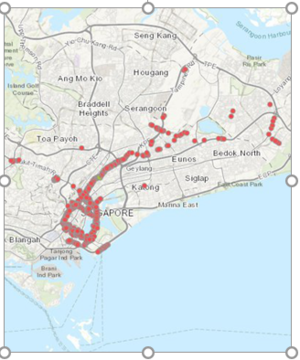
CRS conversion — The other transformation that needed to be performed was to convert the borehole coordinates from the SVY21 projection to the WGS84 projection for easier visualization, and standardization of the coordinate reference system.
