ANLY482 AY2016-17 T2 Group23 Silver Daisies Analysis and Findings
Contents
Data Quality
Data given are in two ways. The daily operation schedule data is excel or hard copies format, which 1 day represent 1 sheet, structured in a form of tables rather than a database structure. The vehicle data are automatically collected in their system in a summary format. Therefore to get daily data will require manual selection of dates and manually extract them.
There are discrepancies between the drivers' driving hours time log and the vehicle's moving duration as drivers change their vehicles occasionally. Also, because there is a lack of variables that directly reflect the driving cost such as the amount of fuel consumed. In the daily operations scheduling data, some of the vehicle numbers are missing, therefore unable to identify the vehicle used. Many of the writings for driver names and purpose of appointment are also very inconsistent and ambiguous. There are missing data in February because of file corruption which has been deleted. There are also missing data in vehicle data of 1 vehicle because of 2 months late installation of their new tracking system.
Data Exploratory Analysis
APPOINTMENT DEMAND ACROSS WEEKS
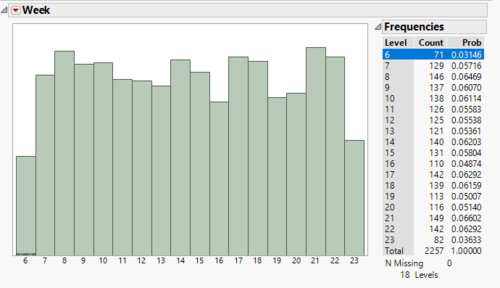
From the chart above, we can see that the starting and ending of the 3 months period has a lower number of appointments. Level 6 to 10 represents the weeks in February, 11 to 14 represents the weeks in March, 15 to 18 represents the weeks in April, and 19 to 23 represents the weeks in May.
The team believes that the lower number of appointments in week 6 and week 23 could possibly be due to the way the number of appointments is counted in jmp. As 1 Feb 2017 (start of week 6) begins in the middle of a week while 31 May 2017 (week 23) ends in the middle of a week, the lower number of appointments is most likely due to the fewer number of days taken into account.
Based on the above reasoning, the team will only take into consideration the data for week 7 to week 22. Thus, we could see that the average number of appointments across the 16 weeks is relatively constant, with no sharp spikes or drops. This suggests that the demand of MET service does not fluctuate across a short time span, thereby suggesting that capacity planning and utilization may not be of a concern to THK. (ie. Current fleet of capacity is likely to be able to meet demand in the next 3 months)
Also, there are (2257 - 71 - 82)/16 = 131.5 appointments per week on average.
= APPOINTMENT DAYS OF THE WEEK
Based on the dataset, we could see that Mondays to Thursdays have approximately the same number of appointments; while Fridays have a fewer number of appointments on average. This could be due to the shorter operating hours on Fridays. We could also see that MET does not operate on the weekends.
DISTRIBUTION BY APPOINTMENT CLINIC AND PURPOSE
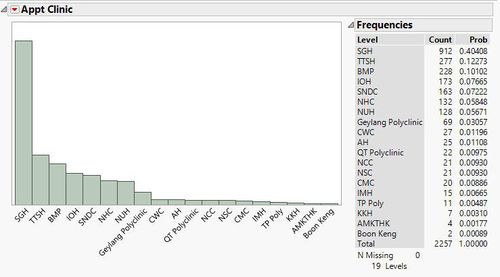
Based on the chart above, we can see that SGH has a significantly higher number of appointments compared to all other clinics. SGH accounts for approximately 40% of the total number of appointments.
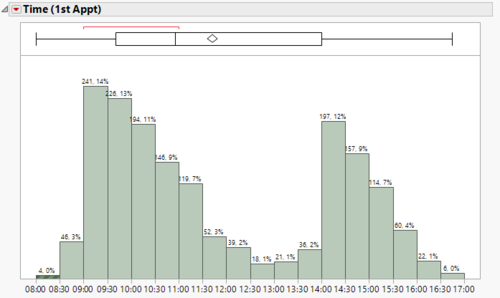
From the graph, we can estimate that the lunch period falls between 1230 to 1330 where there are the least number of appointments. The two highest peak at occurs at 9am and 2pm, which means that the drivers should prepare to pick up PNC clients at 8:15am and 1:15pm. We could also see that 60% of appointments are held in the morning, which could suggest that the demand for MET service is greater in the morning.
Analysis of Vehicle Data and its behaviour
We are currently seeking permission to release our analysis on their vehicle data.


