REO Project Findings Cluster
| Data Preparation | Exploratory Data Analysis | Cluster Analysis |
Having explored the differences between paid and free users, the team decides to perform a cluster analysis via an adapted approach suggested by Punj and Stewart (1983). The approach is: 1. K-nearest neighbour algorithm to detect outliers 2. Calculating Cubic Clustering Criterion (CCC) to decide on number of clusters 3. K-means to obtain final cluster solution The team hopes to identify segments within the paid or free users such that REO can formulate strategies for each segment to effectively engage them. The team decides to exclude entries that have zero enquiries and cobroke requests as enquiries and cobroke requests are the tangible outputs from the platform. Thus, these users have not received any outputs from the platform for the last 6 months which may not be relevant for our cluster analysis. In addition, the technique of k-means clustering only include entries that are fully filled. As such, the team needs to perform missing value imputation by replacing missing data with zero for the analysis to run.
Contents
Paid Users
After filtering, there are 4749 users who have paid for the platform and have received at least one enquiry or cobroke request.
Decision on Clustering Variables
The team has chosen to use key activity indicators from the previous analysis which include the number of sessions, number of listings posted, number of enquiries and number of Cobroke requests received. The number of sessions and listings are then further broken down into weekday and weekend as well as each individual timeslot.

Examining Clustering Variables
The team has conducted a descriptive analysis for all clustering variables to identify any outliers and check for skewness.
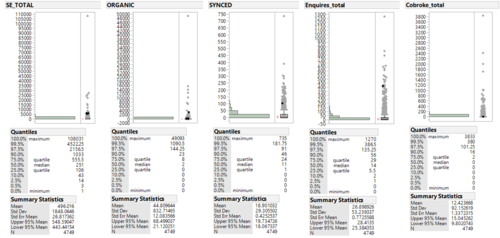
Through identifying extreme outliers that are significantly different from the other points, the team has excluded rows 1328, 3229, 4727 and 6442.
Transforming the Variables
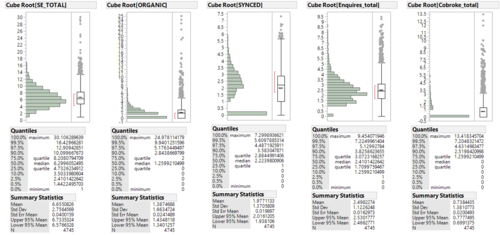
Given that the variables are positively skewed, the team has decided to transform the variable through applying cube root. Logarithmic transformation is not used because there are up to 50% of zero entry in “ORGANIC” and “Cobroke_total” variables. However, we noticed that both variables mentioned previously are still slightly skewed because of the number of zeroes.
K-Means Clustering
The cubic clustering criterion (CCC) is used to estimate the number of clusters using Ward’s minimum within-cluster variance method.
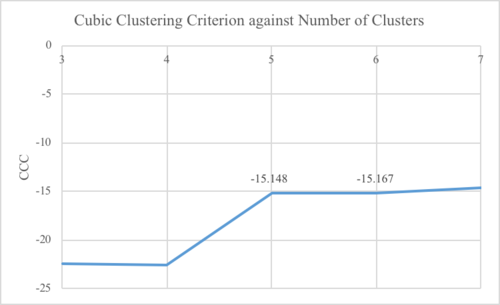
Based on the graph above, the number of clusters decided for k is 5 clusters.
Profiling of Clusters
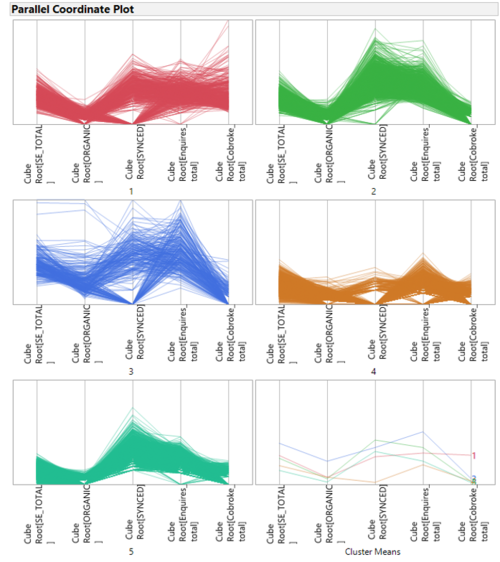
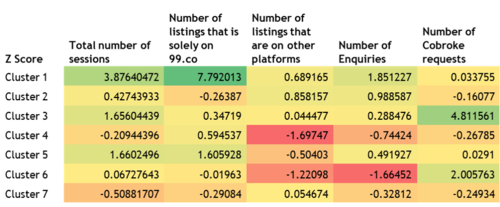
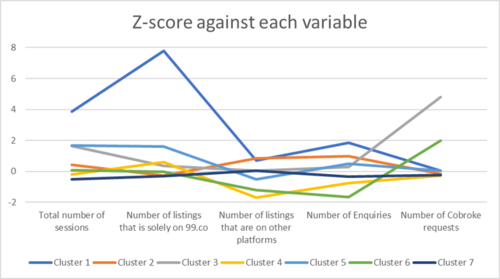
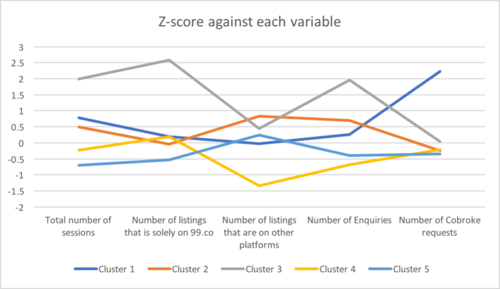
The z-score ranking method is a way to profile the clusters. Z-score is calculated to understand how many standard deviation the cluster’s variable mean is away from the variable mean. A positive number refers to being above the variable mean while a negative number refers to being below the variable mean.


Free Users
After filtering out, there are 5583 users who use the platform for free but receive at least one enquiry or cobroke request.
Decision on Clustering Variables
Examining Clustering Variables
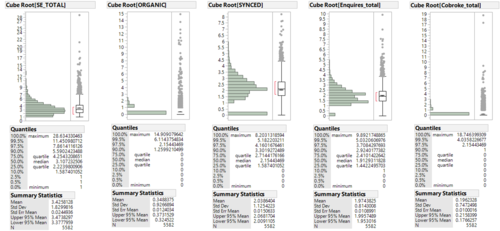
The team has conducted a descriptive analysis for all clustering variables to identify any outliers and check for skewness.
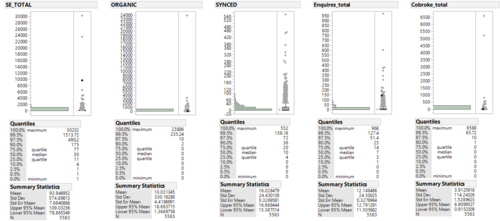
The team decides to exclude row 10583 because it is an extreme outlier.
Transforming the Variables
Similarly, we performed a cube-root transformation for all clustering variables.
Screening Outliers
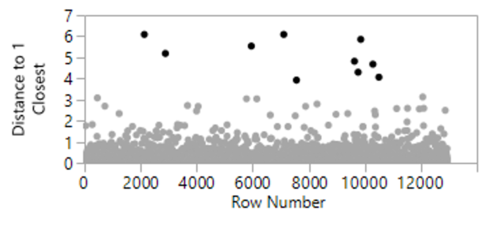
K-nearest neighbours algorithm is a form of hierarchical clustering to identify any outliers. The team decides to exclude 11 rows with the distance to 1 closest above 4.0.
K-Means Clustering
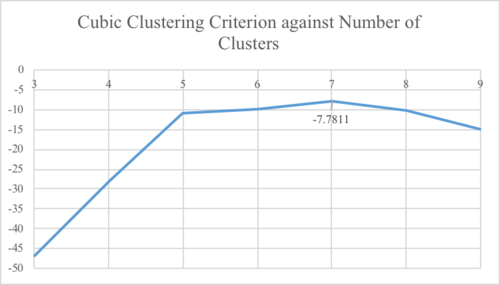
Based on the maximum point for cubic clustering criterion, the optimal number of clusters is 7.
Profiling of Clusters
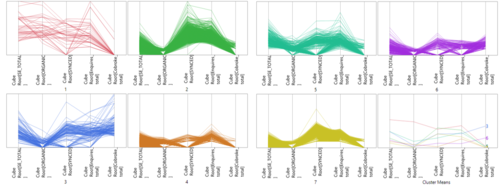
Similarly, we calculated the z-score for individual variable for each cluster.
