ANLY482 AY2016-17 T2 Group19 Data
Contents
Background
In the pharmaceutical industry, it has historically been a challenge to manage hundreds of hospitals and clinics with sizeable differences in the types of drugs, disposable items and the sheer volume in respective purchase orders
While not exclusive to this industry alone, managerial decision making processes have historically relied heavily on transactional raw data and managerial experience
The data set that was used contains sales data from a medium-sized pharmaceutical company with customer base ranging from over the counter pharmacies to clinics around Singapore.
Data Description & Acknowledgement
The raw data was collected from Company Z on the 12th of January 2016 and is described as follows:
- Sales data from Pharmaceutical Wholesale Distributions
- Itemised transactions occurring in the years 2014 to 2016
- 3 main customer types namely General Practitioners, Specialists and Branded Chain Pharmacies
Additional Data was requested to further enhance the quality and relevance of the analysis:
1) Classification list for the medical products sold.
2) Customers with ‘CGP’ as customer type to be mapped to the URA’s Master Plan 2014 Subzone Boundary list.
Other sources of data include:
1) oneMap (Development of R script to geocode customer postal codes)
2) Data@gov (Singapore Subzone SHP File and Master plan 2014 subzone boundaries)
Data Cleaning and Preparation
DATA STAGING
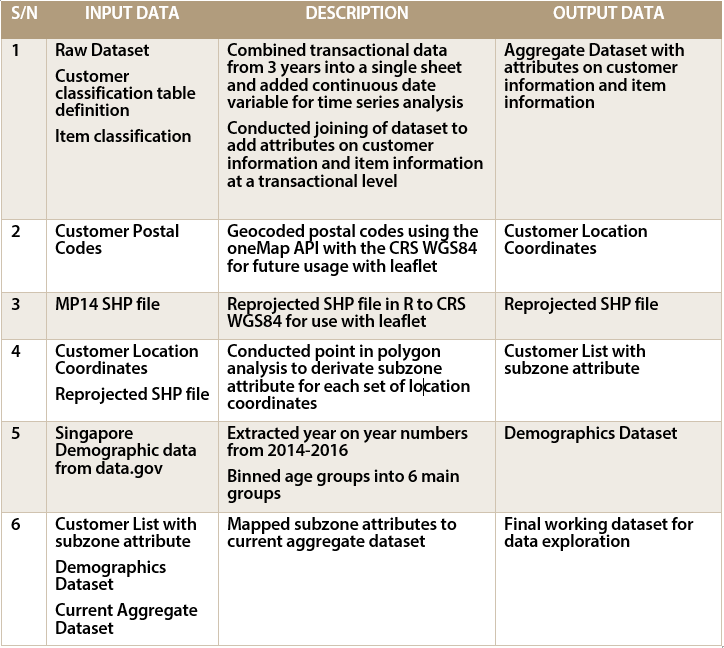
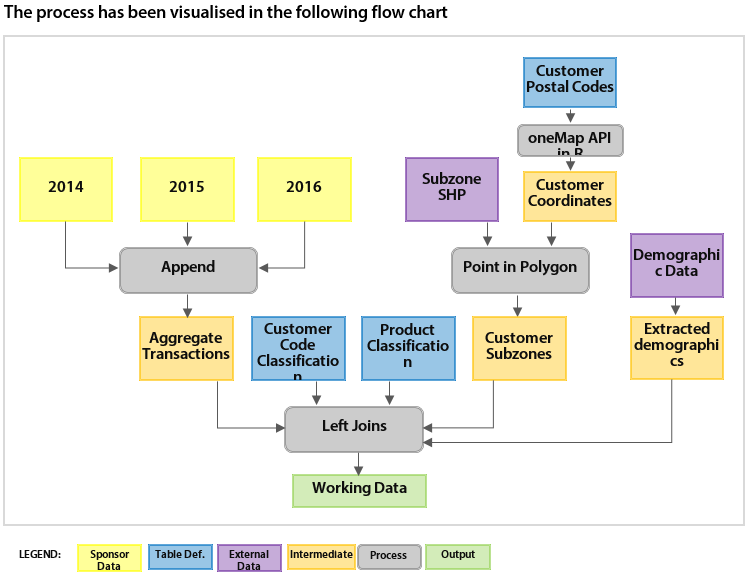
Preliminary data exploration was done in Jmp from SAS prior to data preparation to better understand the structure of the dataset and additional data that would be required. Following which, the bulk of the data preparation was done in R following discussion with our supervisor and the client on continuity post-project. The following log is a record of steps taken to transform, clean and supplement the data for further exploratory data analysis.
Verifications were also carried out with Company Z with regards to anomalies such as negative or zero entries which were corrective in nature and hence were not removed where analysis were done mainly on the aggregation of numbers resulting in the correction of numericals.
Refer to the FINDINGS tab for the results of exploratory data analysis.
Data Preparation for Interactive Visual Analytical Dashboard
Data preparation was separated into 2 main phases based on the frequency for the need of re-launching.
The first phase is carried out in the coredataprep.R script where raw data is taken in and prepared for further processing. In this implementation of the IVAD, raw data received was in the form of transactional data retrieved using SQL from the sponsor’s ERP system. As such, data was in the form of relations and multiple table definitions. The main processes in this phase include: Data aggregation, batch geocoding, point in polygon analysis. Data was firstly prepared by aggregating the 3 datasets (over 3 years) into a single dataset and a date format column was generated. Batch geocoding and point in polygon analysis is carried out on customer postal codes. Batch geocoding was carried out using a simple R script and coordinates were then tagged to the appropriate CRS and point in polygon analysis was done to group the points by subzones marked out in the MP14. As this process is highly computationally intensive, this process runs in the coredataprep script which is to be run on the occasion where new customers are added. The key output of this script is a coredata file which serves as a master working copy of all relevant information. At the current stage of development, this script takes in data in the form of excel spreadsheets, however, at point of enterprise integration, it is highly plausible for tweaks to be made to the script such that it would be able to directly query the system using SQL.
The second phase of data preparation includes less computationally intensive processes that must be run more often are carried out. Such processes include the preparation of data tables for plotting in the app. Generation of tree map coordinates also occurs in this script so as to reduce the resource load at the app stage. By pre-calculating the coordinates, considerable reductions on loading speeds where achieved. The majority of data tables that are to be used for visualisations are generated in this phased and output as an environment image file (.Rdata) that allows for the rapid loading of objects into the shiny app. Other non-R data preparation steps include the identification and reprojection of the MP14 shape files as well as the generation of subzone centre points in the form of shape files. These 2 processes were carried out in Qgis.


