Motivation And Project Overview
People Analytics has been rated as the second-biggest overall capability gap in organizations by the Deloitte university press in 20151. Through people analytics, companies are able to find better hires, improve retention, and find more suitable leaders. This has a direct impact on direction of the organization and hence its growth. Our team has a great opportunity to delve into Social Network Analysis, a fast-growing research field in Analytics through this project.
In this project, our focus is to develop various metrics that would quantify the collaboration between employees, identify the most influential employees and give managers a high-level view of these statistics to maintain a collaborative and efficient workplace. Currently at the company, these metrics are computed based on various sets of data that are primarily collected via pulse surveys. The survey data collection process is slow and makes it difficult for managers to view real-time insights. As an alternative, our team would be computing these metrics based on only email communication data. Since the data is always present in the IT system, an automated data pipeline can be created to compute the metrics and view them on a custom dashboard. We would also be involved in feature engineering to create an unbiased email network before the calculation of metrics.
A primary metric that our team would explore and test for value is a hybrid centrality to calculate an influential score. We are exploring a new equation that combines various
Objective
- Perform Feature Engineering to create a new ‘Trust Score’ algorithm. A trust score is an aggregate weightage shows the strength of communication tie between two employees in a social network.
- Develop a dashboard that displays various metrics that would quantify the collaboration between employees, identify the most influential employees and give managers a high-level view of these statistics to maintain a collaborative and efficient workplace.
- Research and validate the potential of a Hybrid Centrality (potentially a combination of betweeness and degree) calculated from email communication data as a measure of influence score.
Data
We are provided with an excel sheet containing a huge set of email exchange log via the TrustSphere domain. The data provided is clean (Screenshot of the data is shown below).
We will be collecting more data through a survey sent out to all employees of TrustSphere.
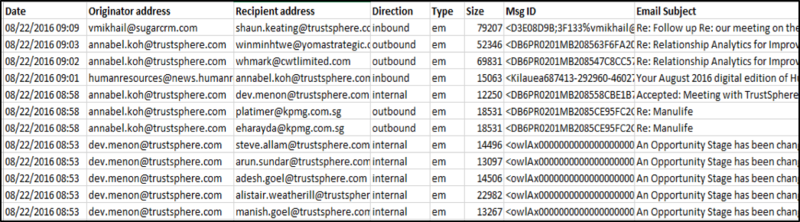
The data consists of the following attributes:
1. Date: date the email was sent/received
2. Originator address: email address of the sender
3. Recipient address: email address of the recipient
4. Direction:
a. ‘Inbound’ – email received by an employee of TrustSphere from an external sender
b. ‘Outbound’ – email sent by an employee of TrustSphere to external recipient
c. ‘Internal’ – email exchanged within TrustSphere employees
5. Type:
a. ‘em’ – message sent via email
b. ‘im’ – message sent via instant messaging
6. Size: number of characters in the message
7. Msg ID: unique ID given to every emailing chain
8. Email Subject: subject of the email
METHODOLOGY
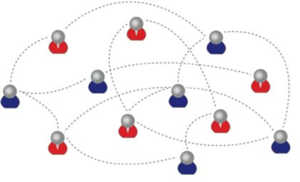
We plan to take a social network analysis (SNA) approach to analyze the data since the goal is to analyze different attributes (preference to work in silos, importance, popularity) of the actors (employees) and the relationship between them (collaboration via email). This view of the data makes it an ideal social networks data when each email address would represent a node and every email would be the relationship between both the nodes.
There are various measures of SNA proposed over the years that help determine the role and importance of a node in the network. The following are a few examples:
• Degree centrality
• Closeness centrality
• Betweenness centrality
• Eigenvector centrality
Our first step would be to explore the network using these centralities, identifying hubs, brokers and groups as well as delving into other SNA concepts discussed by various academic researchers. We would be using softwares such as Gephi, and modelling packages from R such as weighted network packages for these analysis.
Our goal is to come up with our own hybrid centrality score along with a range of other metrics that would quantify an overall importance of each node in the network. Using the insights from step one, we will be creating multiple surveys (source of additional data) for the employees at TrustSphere to find influences (for the hybrid centrality). During the process, we will be referencing to the work of Karen Stephenson and Rob Cross, both of whom specialize in the field of organizational social networks.
In the end, along with the hybrid centrality score algorithm, we will be delivering a comprehensive dynamic dashboard visualizing the most relevant measures that we identify during our project.
SCOPE OF WORK
1. Create a hybrid centrality score as an overall comprehensive measure of the network
2. Identify Silos
3. Assess Collaboration
a. Within departments
b. Within different geographical regions
c. Within projects
4. Assess Influence, Network Strength and Email collaboration
5. Develop a dynamic dashboard to visualize relevant measures
6. The Scope is fluid and will become more specific as the project progresses
|
|
|
|
|

