ANLY482 AY2016-17 T2 Group21 : PROJECT FINDINGS
| Mid-Term |
|---|
Executive Summary
Users
- One third of the registered users do not make purchases
- Top 25% of most valuable customers gives 72.52% of revenue
- On average, customers in the top segment orders 12 times more than bottom tier customers
- Large growth in offline buyers
- Due to offline referrals
- Huge spikes of customers on Sunday and Thursday which corresponds to their weekly collection launches
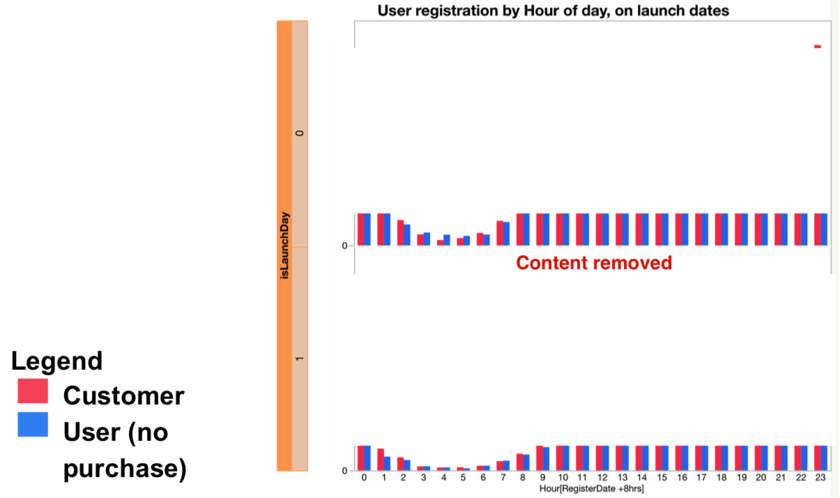
- Customer influx during lunch hours and after dinner
- Influx during lunch is prominent during days of collection launch
Orders
- Decrease in the average product pricing leads to an increase in customer order size and an overall increase sales revenue generated per order
- Hypothesis: Dressabelle's customer base is price sensitive
Order Source
- Organic and referrals are the order mediums for at least 54% of the new customers
- Email is the most effective medium for generating subsequent orders for repeated buyers
- Hypothesis: Email is an effective marketing channel for user retention
Exploratory Data Analysis
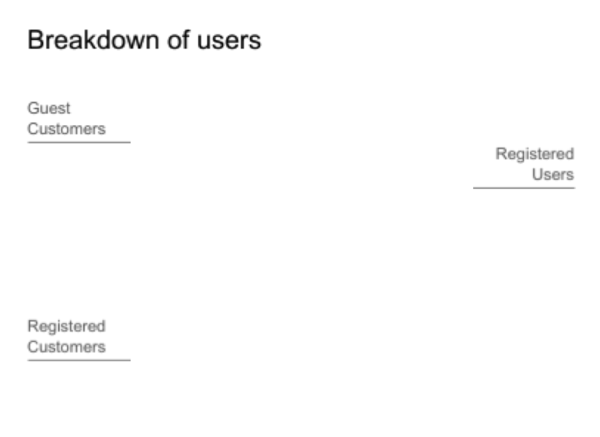
Our team brokedown Dressabelle's user base in three categories:
- Guest Customers (those that purchase without an account)
- Registered Customers (those that purchase with a registered account)
- Registered Users (those that have an account but has never purchased anything)
Our team weighted customers according to their contribution towards Dressabelle's revenue.
Findings:
1. Top 25% of most valuable customers gives 72.52% of revenue
2. Top customers on average orders 12 times more than bottom tier customer
Findings:
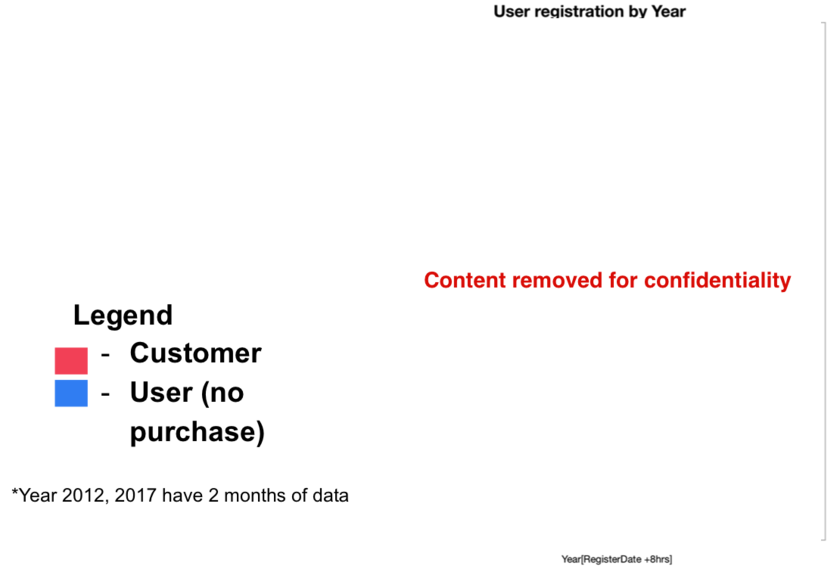
1. Huge growth in 2013-14
2. Large growth of non-buyers in 2016, possibility due to offline referral
Findings:
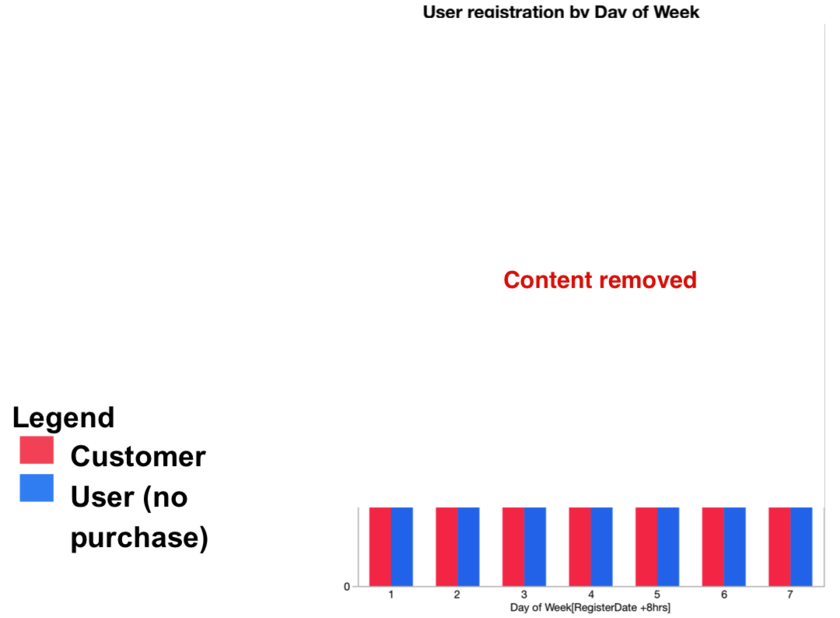
Huge spikes of customers on Sunday and Thursday, which corresponds to weekly collection launches
Findings: 1. Customers influx during lunch hours and after dinner
2. Influx of customers during lunch is prominent during collection launch days
