ANLY482 AY2016-17 T2 Group 2 Findings
| Findings | Literature Review |
|---|
| General Sales |
Total purchase frequency and sales
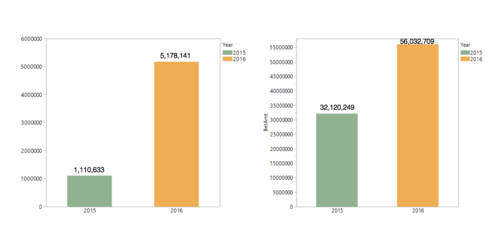
We observed that the purchase frequency has increased from 1,110,633 in 2015 to 5,178,141 in 2016. This amounts to a staggering 366% increase in total bet frequency upon the launch of the online ticketing site.
Total ticketing sales on the other hand has increased from 32,120,249 to 56,032,709, which amounts to only an 75% increase. Comparing to the proportion increase in bet frequency, we identify that although customers are seen to be betting more frequently, it appears they are betting in smaller amounts instead.
Total sales by product
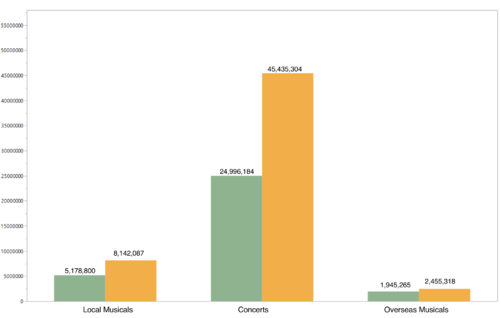
Looking at the total sales of each product, we observed that sales have increased the most for concert tickets by $20,439,120. On the other hand, overseas musical sales have seen the least increase by only $510,053.
Percentage sales by product
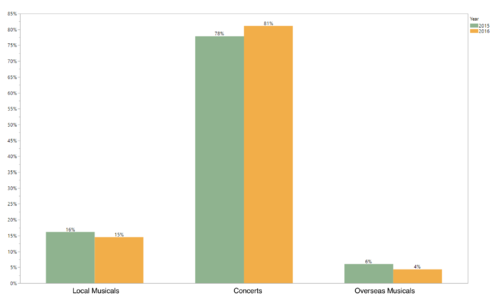
We then decide to take a closer look at the changes in the sales composition in each year. We notice that concert sales remains the highest composition and have increased by 3% from 78% in the previous year to 81% in the current year. Local musicals and overseas musicals on the other hand have decreased by 1% from 16% to 15% and 2% from 6% to 4% respectively.
Product shift for local musicals
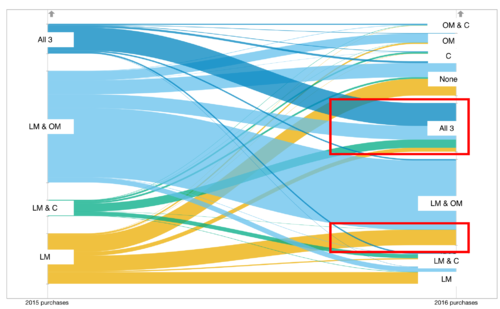
As we are interested to find out if there are changes in the ticketing behavior of customers between the three products, we decided to look into the product shift. As observed from the figure above, we have identified that an increase in local musical customers who are seen to be purchasing on all of the three products. In addition, we also observe a noticeable amount of customers who used to only purchase local musicals, purchasing on overseas musicals after the launch of the online ticketing site as well.
Product shift for overseas musicals
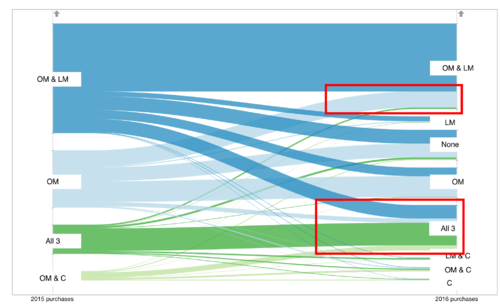
Looking at the product shift for overseas musicals customers, we observe that there a significant proportion of customers who used to only purchase on overseas musicals, purchasing local musicals as well. In addition, it can be seen that there is an increase in overseas musicals customers who are betting on all the three products.
Product shift for concerts
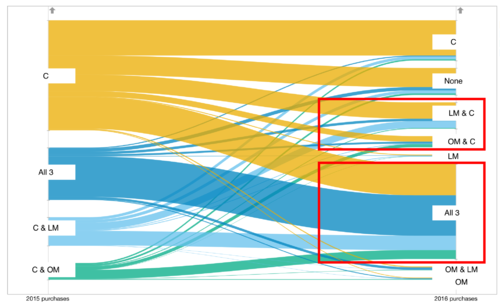
From the figure above, we detected that many of the customers who used to purchase on concerts only, have seen to be purchasing musical tickets as well. Moreover, we also find that many concert customers now are also customers for both local and overseas musicals.
| Transaction Variables |
Having looked at the general sales pattern, the next part of the exploratory data analysis delves into a number of key transaction variables which illustrates the differences in the purchasing behavior before and after the launch of the online ticketing site. These transaction variables include hour of day, day of week, ticket amount, channel (internet or phone) and ticket types.
Total purchase frequency and percentage frequency by hour of day
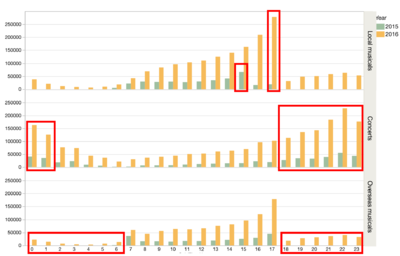
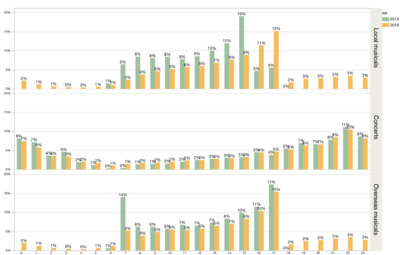
First, we observe the differences in purchasing behavior for the three products through the hour of the day sold. We noticed that there is shift in the peak of the hour sold from the 15th hour (3PM) to the 17 hour (5PM) for local musicals.
For concerts, we observed that there is significant increase in purchasing in the late night, especially from 18 (6PM) to the 1 (1AM) wee hour.
Overseas musical sees a shift in the peak hours from the 7 (7AM) and 17 hour (5PM) previously which is typically the time before customers starts and after they end work, to mainly the 17 hour (5pm). In addition, the purchasing behavior are more evenly spread out now given the availability of 24 hours purchasing on the internet as opposed to purchasing within the restricted phone working hours previously. This is true for local musicals as well.
Total purchase frequency and percentage frequency by day of week
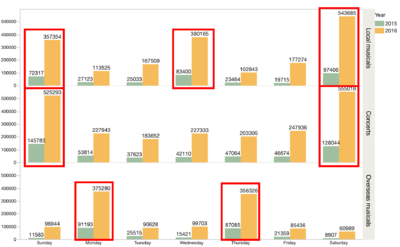
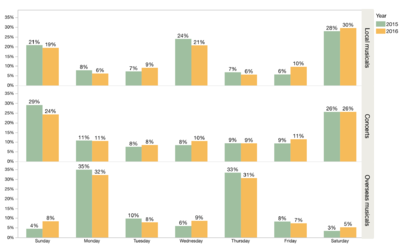
We can see that most purchases occurs on Monday, Wednesday, Friday for local musicals and Monday, Thursday for overseas musicals which are the common performance dates. This trend is similar across both years, with purchases increasing more significantly on these days as well.
For concerts, most purchases occurs on the weekends.
Ticket amount by product
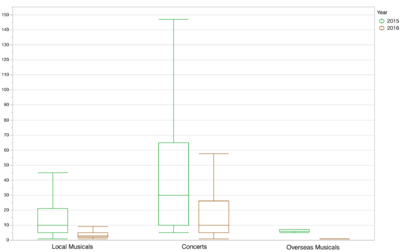
We observe the median and the interquartile ranges for the ticket amounts have decreased in general. For local musicals, the median has decreased from $10 to $3, $30 to $10 for concerts and $7 to $1 for overseas musicals. This concludes that customers are generally purchasing lower amount tickets after the launch of the online site.
Total purchase frequency by channel
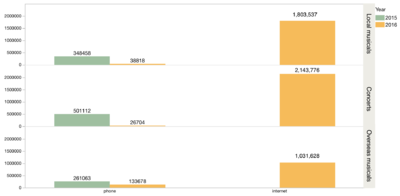
Looking at the total purchases by channel, it is apparent that the internet platform also sees a significant increase in new customers. In addition, majority of the customers have also moved from phone to the internet platform. Phone customers sees a 88% decrease for local musicals, 95% decrease for concerts and a 49% decrease for overseas musicals. It appears that overseas musicals have retained more phone sales compared to the other two products.