ANLY482 AY2016-17 T2 Group7: Project Findings
Analysis 1: Insights on Search Count by Date:
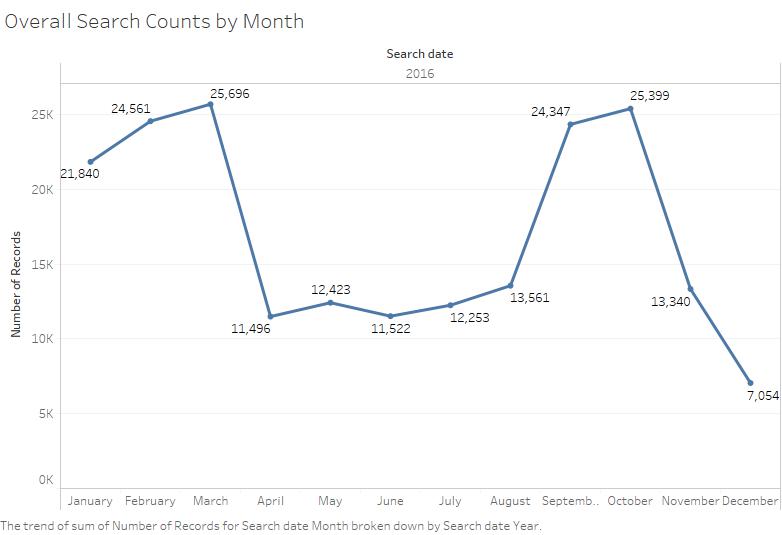
Chart 1: Overall Search Counts by Month
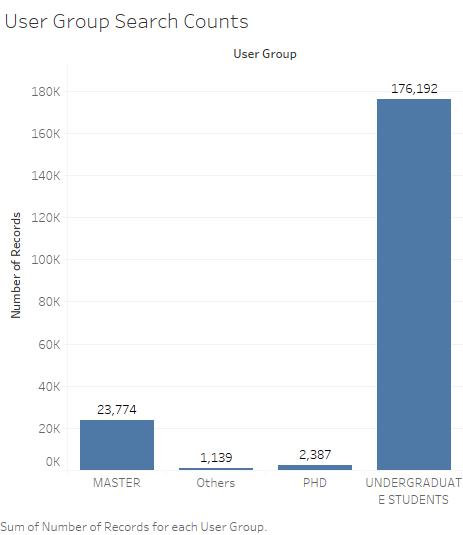
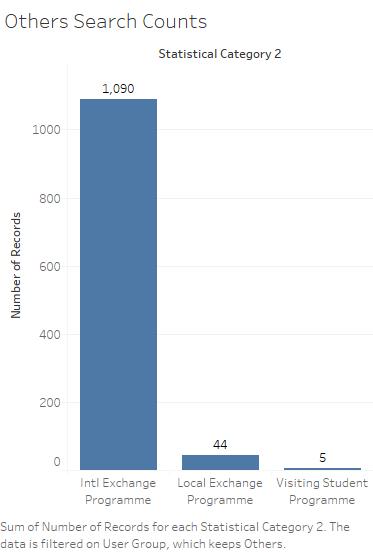
Chart 2: User Group Search Counts
Chart 3: Search Count of 'Others'
| Subject Matter: | Awareness of the number of searches throughout the year |
| Thought Process: | We want to understand the number of searches throughout the year and see if there are any observable trends. From our personal anecdotes as Seniors in SMU, we believe there will be a spike in searches especially during the project weeks (Week 4 onwards). Thus, we initiated the break down of the number of searches by months, to have a better look at where the peak periods are. |
| Analysis: | There is great variation in the number of searches across the span of a year, and these searches on the Ezproxy are contributed by students - Undergraduate, Masters, PhD and others (international exchange, local exchange, visiting students). As the users of the Ezproxy site are students of Singapore Management University, the spike in the number of searches can be seen during the months of the regular semesters (Term 1 and 2) - January to March and Mid-August to November.
|

Chart 4: Search Count by Days for Semester 1: Jan-March 2016

Chart 5: Search Count by Days for Semester 2: Aug-Nov 2016
| Subject Matter: | Understanding the students’ behaviours in searches during the semesters. |
| Thought Process: | In SMU, 1 of the common perception is that SMU students study all day everyday, even the weekends. Thus, we want to see if this perception of SMU students is indeed true.
Next, we want to see if there is a surge in searches when the semester reaches the week where group projects are released. This is because projects in SMU largely requires the students to perform desk research and 1 of the many places to do so is through the SMU library’s EzProxy e-resources database. |
| Analysis: | From the charts in Semesters 1 & 2, we noticed that there is a dip in the number of searches performed every weekend (Saturdays & Sundays). For example, there is a plunge in the number of searches on 16th of January (Saturday). Thus, this may show that the perception of SMU students studying all day everyday and even the weekends may be untrue. Or it could be that SMU students generally do not perform as many searches for their research on weekends.
|
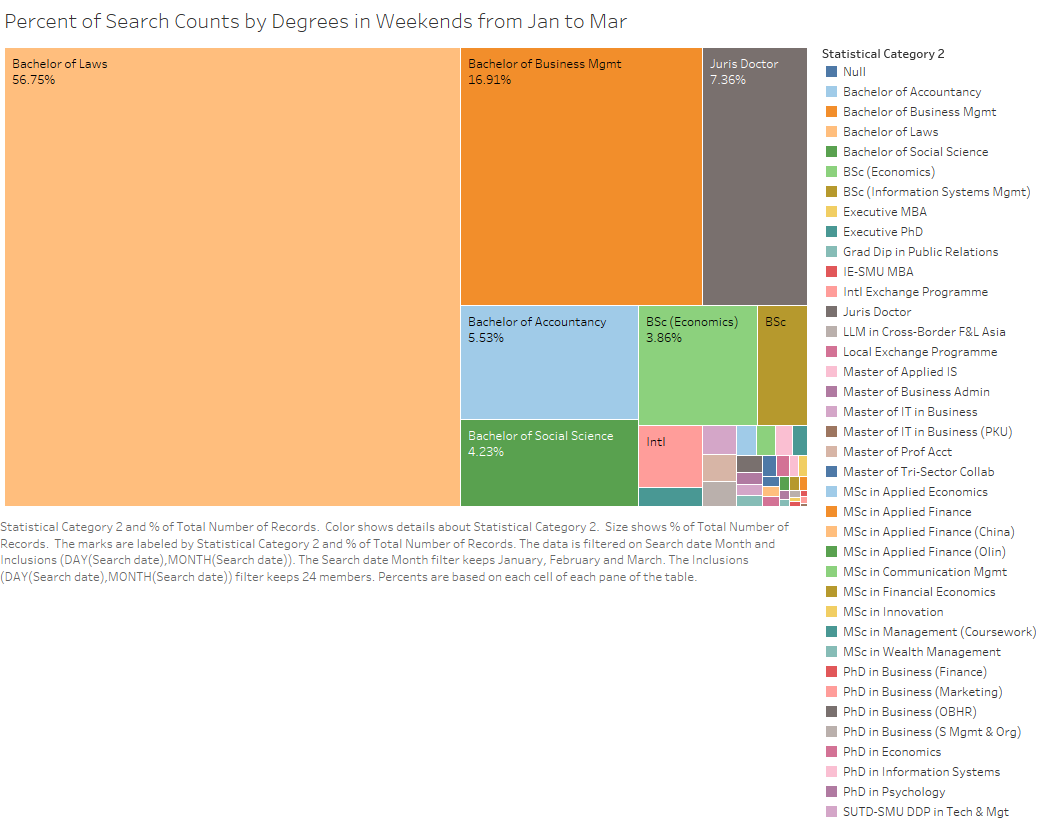
Chart 6: Percentage of Search Counts by Degrees in Weekends for Semester 2: Jan-March 2016
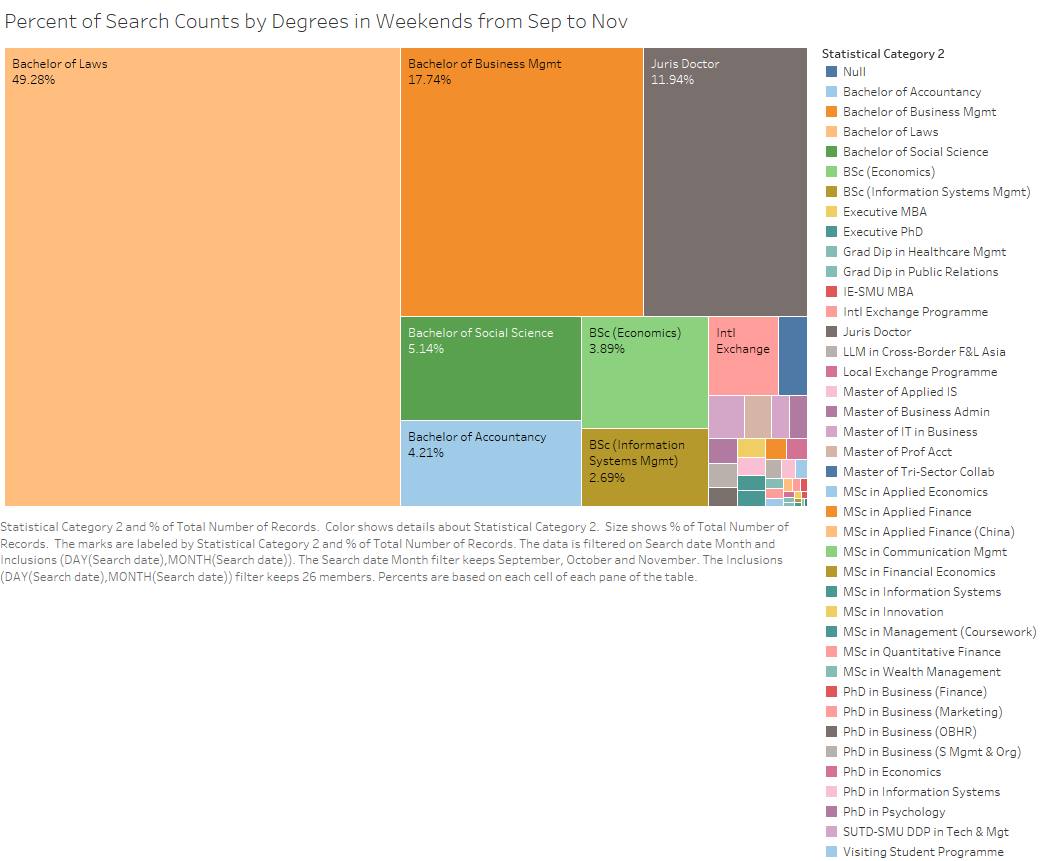
Chart 7: Percentage of Search Counts by Degrees in Weekends for Semester 1: Sep to Nov 2016
| Subject Matter: | Understanding the percentage of searches contributed by students across their Degrees during weekends |
| Thought Process: | We want to dive deeper into the analysis of weekend searches and find out who are the ones still contributing to it, despite the dip in number of weekend searches. |
| Analysis: | In Chart 6, we noticed that 56.75% of searches were done by students enrolled in the Bachelor of Laws programme, which occupies a majority of the total number of searches performed on weekends. Additionally, 16.91% of searches were done by students from Bachelor of Business Management and 7.36% from the Juris Doctor programme.
One of the possible conclusions from this observation is that students enrolled in the Law field (Bachelor of Laws & Juris Doctor programme) do not typically stop performing searches and/or stop researching simply because it is the weekends. In addition to that, students in the Bachelor of Business Management programme contributes significantly to the number of searches on weekends too, perhaps due to the nature of the programme which is research-intensive. This is in contrast to students from other non-research intensive programmes such as Bachelor of Science (Information Systems) at 1.64% of total number of searches. In Chart 7, we can observe that the abovementioned trend is consistent for students in the Bachelor of Laws, Bachelor of Business Management and Juris Doctor. Thus, our trend analysis holds consistent for both Semesters 1 and 2.
|
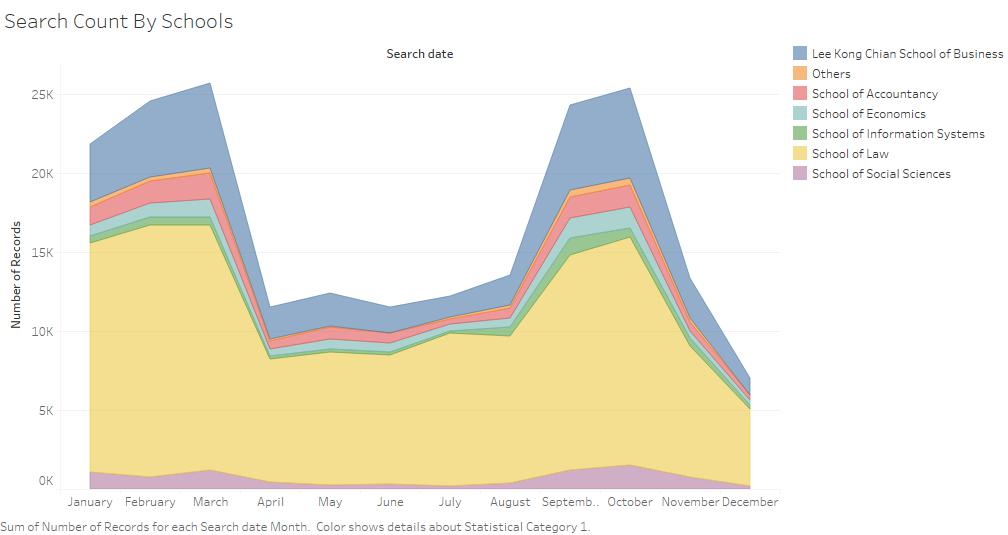
Chart 8: Search Count by Schools for 2016
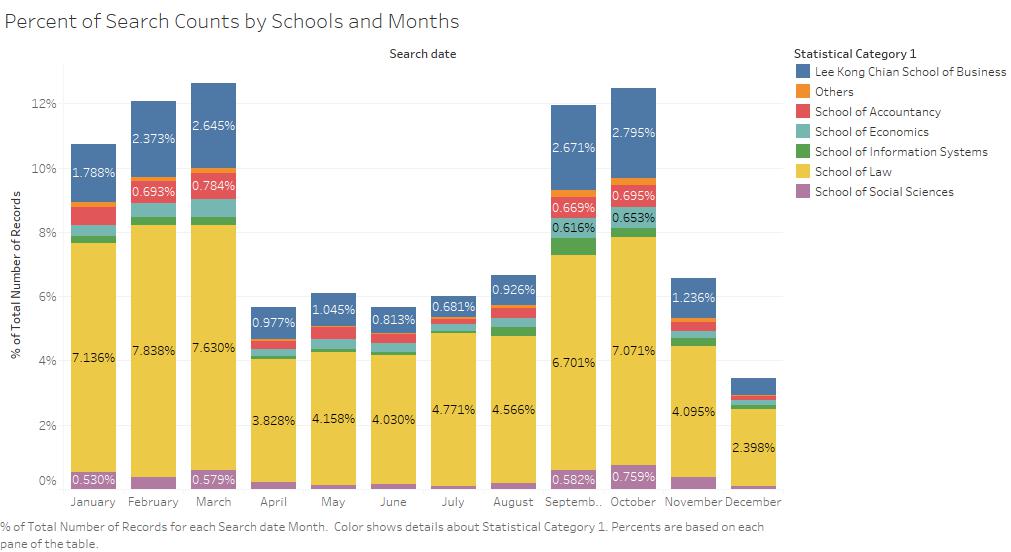
Chart 9: Percentage of Search Counts by Schools & Months
| Subject Matter: | Understanding the percentage of searches contributed by students across their Degrees for 2016 |
| Thought Process: | After learning about the different spikes as a whole, we then consider the possibility of some schools being greater contributors to the searches. The main contributors to these searches should most likely be similar to that of the weekends, and thus, we broke down the search count by schools over the months to analyze the general trend of searches across each degree. |
| Analysis: | Similar to the weekend searches, we observed that the top 3 percentages of searches still come from the students enrolled in the Bachelor of Laws, Bachelor of Business Management and Juris Doctor.
In Chart 8, we observed that even though Semester 1 and Semester 2 starts in Aug and Jan respectively, the total number of searches in Jan is significantly higher than that of Aug. This is where additional information such as the exact dates of the start of Semesters 1 & 2 comes in handy; Semester 2 starts on 4 Jan 2016, thereby occupying the entire month of Jan whereby Semester 1 starts only on 15 Aug 2016, thereby occupying only half of the month of Aug. Without such additional information, analysts may conclude that perhaps students in Semester 2 are more hardworking than in Semester 1 in terms of the number of searches they perform.
|