ANLY482 AY2016-17 T1 Group6/Final Progress
| Home | Team | Project Overview | Midterm Progress | Final Progress | Project Management | Documentation |
Communications data, such as the emails exchanged by employees, can be of rich insight when analyzing and predicting business performance.
For a B2B company such as Trustphere, communicational efficiency from their sales team is essential for increase in revenue and growth. Acknowledging that sales numbers in dollars are not adequate by themselves to gauge the potential and performance of the sales team, our team has analyzed emails exchanged by salespeople, to report specific insights that enable the senior management to monitor individual salesperson’s progress in the sales cycle and identify bottlenecks in the sales process.
These insights include, but are not limited to, the salesperson’s internal and external network, response time and communications promptness when communicating with a client, progress in current sales accounts and a postmortem of failed accounts. Our attempt is to make sales performance based on communications efficiency as visible and measurable as possible, hoping that it will not only reform the commission structure to motivate employees to hone their communication skills but also give the management a bird’s eye view of the real time sales progress, instead of knowledge of just the successful accounts.
TrustSphere, a software-as-a-service company, delivers Relationship Analytics solutions to organizations enabling them to unlock the value of their networks. This set of analytics surfaces insights that help clients across the globe improve key business issues including sales force effectiveness, enterprise-wide collaboration and corporate governance. Solutions are delivered through leading technology and business partners such as IBM, Salesforce.com and SugarCRM.
Being a B2B company, TrustSphere has a dedicated Sales team of 19 people (as of 31st August 2016) around the world. The team’s responsibility is to approach prospective clients with TrustSphere’s product, persuade them to agree to a meeting and to commission a proof of concept (POC). Once a salesperson gets a client to agree to a meeting or a POC, he/she qualifies for a sales commission. The team is also tasked with seeking out partners and maintaining partnerships for the company.
Apart from sales and commission dollars, the company has little information about the sales process, how efficiently salespeople communicate with clients and the extent of internal collaboration with other TrustSphere departments. Our team was therefore engaged to use their existing email communications data to evaluate communicational efficiency of each individual salesperson and develop a reporting model (dashboard) for the Sales Director to have a bird’s eye view of real-time sales progress.
While much has been explored in the field of Sales Analytics, a recent study reveals that few companies have delved into the area of Sales People Analytics. Deloitte found that almost 70% of companies felt they were weak in using HR data to predict workforce performance and improvement.
Conventional wisdom tells us there are several ways to evaluate a salesperson’s performance, such as the size of his external network and his sales figures. New research says this is an oversimplification of sales practices . Steward et al. (2010) found that higher-performing salespeople regularly activated their internal company networks to coordinate a team of experts tailored to serve a particular customer. Purely focusing on sales figures as an indicator of performance also neglects the time aspect. Sometimes long-term projects take months to realize revenues. Harvard Business Review also found that spending time with both internal and external connections contributed to success in selling.
Overwhelming research evidence pointing at the inadequacy of looking purely at sales figures. Further, the importance of ‘People Data’ re-emphasizes the criticality of communicational efficiency. Currently TrustSphere’s approach to assessing performance in this regard is self-reporting and review meetings with the Sales team. The team functions largely independently and management has little understanding of communicational effort and hardly any insight into opportunities for improvement in the sales process other than feedback from salespeople.
We intend to use TrustSphere’s data of their salespeople’s email communications to measure outreach, relationships, clients, responsiveness, collaboration and sales progress of the Sales team by adding a layer of mathematical and data-supported insights. Furthermore, we intend to provide actionable recommendations on better data collection so that future analysis becomes easier for TrustSphere. Lastly, we aim to develop a reporting model (dashboard) prototype that TrustSphere can adopt and develop for tracking performance in future. We foresee that with continuous and real time insight into salespeople communications, senior management will be able to employ better decision making capabilities with regards to the sales process and overhaul training and commission structures for the Sales team.
Our project began with the primary objective of making the sales process and communicational efficiency as visible and measurable as possible. Thus, our team interviewed sales associates and discussed the possibilities with our point-of-contact at the company to gain insight into what information would be useful and most critical to them when it came to evaluating sales performance. With that, we explored the range of possible questions and areas of analysis we could delve into. After repeated meetings with the client and consultations with our advisor, we narrowed our scope down to:
1. Relationship Report
- Analyse the volume and strength of Internal and External Relationships salespeople have developed over the analysis period
- Consider the frequency and recency of emails exchanged by and with the salesperson to highlight their communication and collaboration efforts
2. Clients and Sales Stages
- Report the sales progress for each account up-till 31st August i.e. how many accounts are active and what stage of the sales cycle they are in
- Evaluate the performance of each salesperson depending on how many accounts they have in each stage, their response trends in each stage, progress from historical communication indications etc.
- Provide a post-mortem on inactive accounts, reporting on how long communications with a client lasted, in what stage communications ended and which salespeople were responsible
3. Social Network Analysis
- Analyse collaboration trends e.g. which departments salespeople interact with more, whether there lies a communication gap between teams
- Examine overlap trends, to see if multiple salespeople interact with the same client, and whether abnormalities exist within the overlap
Data was provided to us by the client in Week 3. They provided us with 1 main dataset of email communications of sales employees and a supplementary staff list to aid our analysis with details of departments and hierarchy in the organization.
1. Daily Email Communication Dataset
This dataset contained year-to-date (up till 31 August 2016) records of daily email communication data of all 19 TrustSphere sales people across the globe. This data includes the following 6 variables. (109,771 Records)
- Date: Includes the date and time of a particular email being sent
- Originator address: Sender email address
- Recipient address: Receiver email address
- Direction: Nature of communication (internal, inbound or outbound)
- MsgID: Unique message ID of emails sent
- Email Subject: Email subject header
2. Staff List
The dataset lists all of TrustSphere staff (57) with the following 5 variables.
- Name
- Hierarchy
- Department
- Position
- Location
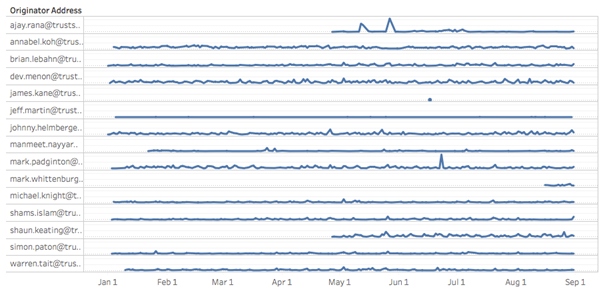
Our first step was to check confirm that salespeople have been actively communicating through email, as appointment and exit dates were not made available to us, we had to confirm that all sales employees were in fact active and employed with TrustSphere during our Analysis period.
1. Summary of Findings
- No records were found for 3 Salespeople
- 1 Salesperson had only sent one email over the course of 7 months
- 1 Salesperson sent an abnormally low number of emails, leading to an assumption that he has a secondary work email
- 3 were new hires made in the analysis period of 1st January to 31st August 2016
2. Implication
After deliberation of the results with TrustSphere, the 3 salespeople with no records and the 1 with a single record were to be removed from our analysis under the assumption that they were no longer employed by TrustSphere. The salesperson with a low number of emails and the 3 new hires were to be included in the report but filtered out as and when they were likely to skew results. Therefore analysis was carried out with 14 active salespeople.
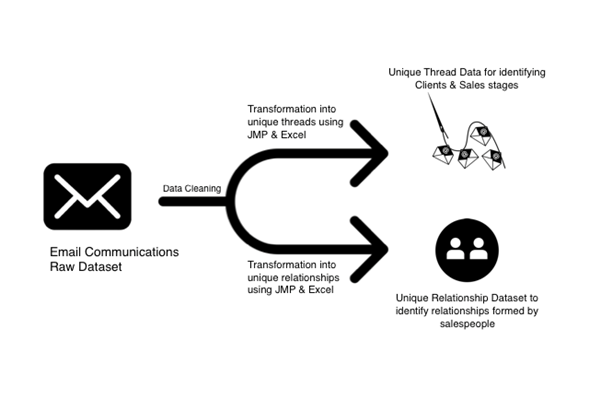
The data had to be cleaned and transformed in order for us to compute and visualize our desired metrics and attributes. Email communications contain a lot of junk and irrelevant emails that need to be cleared out as well. We cleaned and transformed the Initial dataset into two separate datasets to better address the needs of our scope.
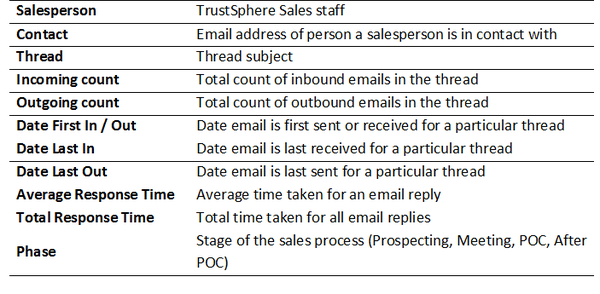
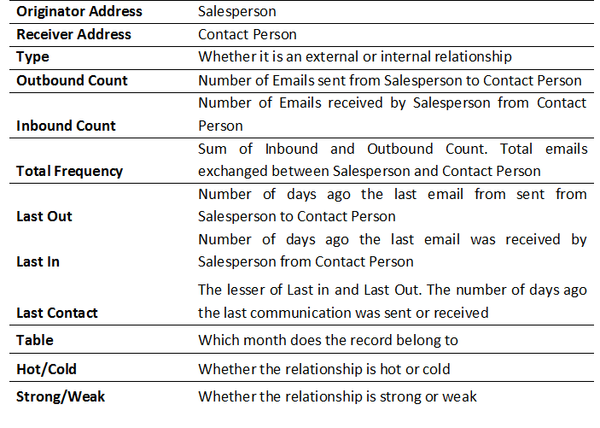
Details of the Data cleaning and transformation process can be found in our Mid-Term Proposal. The variables for the datasets are as follows:
1. Classification of Metrics
Following our exploratory analysis and during the transformation process of the data and repeated meetings with the client, we established certain classifications and metrics that ease reporting of sales performance.
1.1 Clients & Stages
- Sales Stages
- Prospecting Stage: When a prospecting email is sent out to a prospective client, they may or may not respond
- Meeting Stage: When the client has responded favourably to the prospecting stage and TrustSphere has a scheduled pitch meeting with the client
- POC Stage: When the client has agreed to commission a product trial
- After POC Stage: Follow ups, quotations, contracts etc
- Active and Inactive Clients
- Active Client: Contact has taken place within the past 30 days
- Inactive Client: No contact has taken place in the past 30 days
- Failed Prospects
- “Failed Prospect” is a classification that indicates what percentage of prospecting emails sent out failed to progress onto the meeting stage
1.2 Hot & Cold Relationships
- Hot Relationship: Last contact was made less than 3 days ago
- Cold Relationship: Last Contact was made more than 3 days ago
1.3 Strong & Weak Relationships
- Strong Relationship: Above average number of emails exchanged AND is a hot relationship
- Weak Relationship: Below average number of emails exchanged AND/OR is a Cold Relationship
2. Data Dictionary
2.1 Unique Thread Dataset (For Clients and Stages)
Two things to note:
- Each Record is a unique thread of emails exchanged between a salesperson and an external contact.
- This data focuses solely on client relationships therefore internal and partner communications were filtered out.
2.2 Unique Relationship Dataset
- Each record is unique relationship between the Salesperson and a Contact.
- The relationship may be Internal or External.
