AY1516 T2 Team AP Analysis Findings
| Data Retrieval & Manipulation | Findings | Post interim plan |
|---|
Data Exploration at Follower Level
Understanding Retweeters' preferences
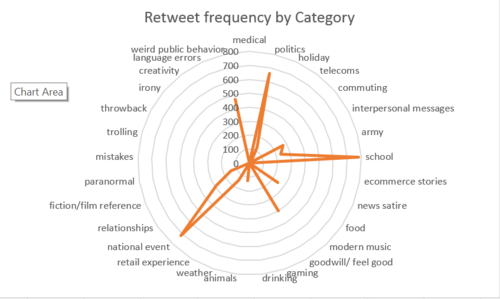
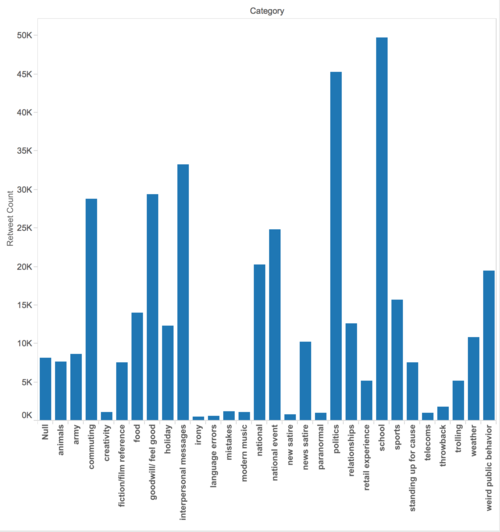
We looked the combined data that we have gotten - each follower of SGAG, with a sampled dataset of the number of retweets that have for SGAG posts, grouped according to category. It is interesting to see that certain categories stand out and are much likely preferred than others. In particular, the categories of tweet of content most likely to be retweeted in order of highest to lowest preference seem to be School, National Events, and Politics, with 16.9%, 15.5% and 14.3% of the total number of retweets respectively. Our initial intuition is that since these are the more popular kinds of content that Twitters read through, and thus in effect want to share it with others through retweets, SGAG can steer themselves towards creating more of these content.
We further evaluate these 3 top categories identified to be retweeted the most, and that it is probably due to 2 reasons: firstly, general uptake and viral tweets that are generally retweeted by the general population of followers of SGAG, or secondly, certain groups of retweeters that are more active in retweeting. In other words, these are the influencers of the network, and if accurately identified, will be critical to SGAG's growth and should be SGAG's primary group of twitter users to target for maximal effect. Even within this group of influencers, each Twitter user probably has a preference for each category of retweet. We hope to find a possible profile of users that tend to select and retweet specific categories of content.

