G7 Project Overview
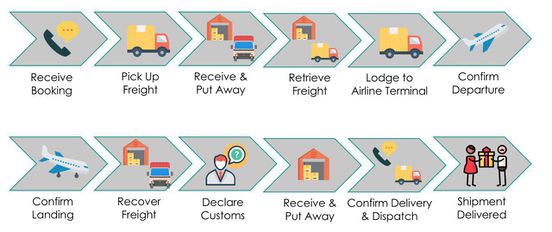
Figure 1 highlights the journey of a shipment, from the point a booking is received, till it is delivered to its end destination. Due to the vast spread of the Sponsor’s operations, serving a single BU often requires shipments to be delivered to several parts of the globe. GAMs have voiced concerns about the lack of visibility they have on the operational performance delivered by Company X. They amount this to a lack of standardization in the selection of parameters while attempting to visualize the same.
The GAMs have voiced concerns with the existing visualization platforms to analyze the traffic patterns of the shipment. Currently, a typical GAM would visualize available data on his local files using simple Pivot Tables and Charts on an Excel Spreadsheet. This prevents a comprehensive one-stop analysis from being done. Moreover, due to a lack of standardization in contributing parameters across several business accounts, several insights do not get generated.

