Difference between revisions of "ANLY482 AY1516 G1 Team Skulptors - Technology"
| Line 82: | Line 82: | ||
<b>Before – NetBeans IDE</b><br/> | <b>Before – NetBeans IDE</b><br/> | ||
<br/> | <br/> | ||
| + | [[Image:NetBeans.png|500px|link=]]<br/> | ||
Our team initially used the NetBeans IDE. That is because our team had been using NetBeans since year 2. Thus, we are more familiar with NetBeans. The NetBeans IDE also provide some forms of convenience: | Our team initially used the NetBeans IDE. That is because our team had been using NetBeans since year 2. Thus, we are more familiar with NetBeans. The NetBeans IDE also provide some forms of convenience: | ||
# Pre-configured | # Pre-configured | ||
| Line 91: | Line 92: | ||
<b>After – Notepad++</b><br/> | <b>After – Notepad++</b><br/> | ||
<br/> | <br/> | ||
| + | [[Image:Notepad.png|500px|link=]]<br/> | ||
After our discussion with Prof. Kam, the team has decided to opt for a lightweight editor, namely the Notepad++. The reason for doing so is because there are a lot of redundant add-ons when we develop using NetBeans, such as the build.xml. Ideally, we are going to be focusing mainly on the web page interface, which is html centric. The library we will be mainly using, D3.js, only requires an html surface, where Notepad++ more than suffices. With regards to debugging, our group has grown comfortable with using the Chrome debugger. Since it is a web page, being able to debug on the webpage itself aids us in determining the line where the error lies in. Similarly, we can make use of the “Element” option in the debugging tools to check if our CSS is incorrect or if the D3.js code caused some layout issue on CSS.<br/> | After our discussion with Prof. Kam, the team has decided to opt for a lightweight editor, namely the Notepad++. The reason for doing so is because there are a lot of redundant add-ons when we develop using NetBeans, such as the build.xml. Ideally, we are going to be focusing mainly on the web page interface, which is html centric. The library we will be mainly using, D3.js, only requires an html surface, where Notepad++ more than suffices. With regards to debugging, our group has grown comfortable with using the Chrome debugger. Since it is a web page, being able to debug on the webpage itself aids us in determining the line where the error lies in. Similarly, we can make use of the “Element” option in the debugging tools to check if our CSS is incorrect or if the D3.js code caused some layout issue on CSS.<br/> | ||
<br/> | <br/> | ||
| Line 99: | Line 101: | ||
<b>Before – Excel</b><br/> | <b>Before – Excel</b><br/> | ||
<br/> | <br/> | ||
| + | [[Image:Excel.png|500px|link=]]<br/> | ||
The team’s initial choice of analytical tool was to use excel as we were familiar with its data analysis features such as pivot table, charts and what-if analysis. However, the idea was soon scraped due to several problems faced. | The team’s initial choice of analytical tool was to use excel as we were familiar with its data analysis features such as pivot table, charts and what-if analysis. However, the idea was soon scraped due to several problems faced. | ||
# Slow start up | # Slow start up | ||
| Line 111: | Line 114: | ||
<b>After – JMP</b><br/> | <b>After – JMP</b><br/> | ||
<br/> | <br/> | ||
| + | [[Image:JMP.png|500px|link=]]<br/> | ||
After several discussions, the team brainstormed and came to a common consensus to adopt the use of JMP software from SAS. JMP is a software created by SAS for its users to explore data analysis visually, through its visual, interactive, comprehensive and extensible features. As only one of the team had been exposed to JMP before, the team arranged for a meeting for a quick jump start session on the usage of JMP. There were several benefits of using JMP that the team had experienced since the switch from excel to JMP. | After several discussions, the team brainstormed and came to a common consensus to adopt the use of JMP software from SAS. JMP is a software created by SAS for its users to explore data analysis visually, through its visual, interactive, comprehensive and extensible features. As only one of the team had been exposed to JMP before, the team arranged for a meeting for a quick jump start session on the usage of JMP. There were several benefits of using JMP that the team had experienced since the switch from excel to JMP. | ||
# Interactive table and dialog | # Interactive table and dialog | ||
Revision as of 01:11, 16 April 2016
![]()
| Summary | Description | Warehouse Tour new! | Methodology new! | Technology new! | Limitations & ROI |
Before – Task Allocation after Meetings
The allocation of workload was done after meetings with Prof Kam or sponsors verbally. This was rather inconsistent as each of the team member were not aware of each other job tasks once they have completed their assigned tasks. For instance, there was once where there was duplicated work as team members had each started on doing the interim proposal report on their own assumption that there would not be no one working on the report too. This was rather inefficient as time wasted on doing these duplicated work could have been otherwise utilized for other tasks such as coding.
After – Trello Online
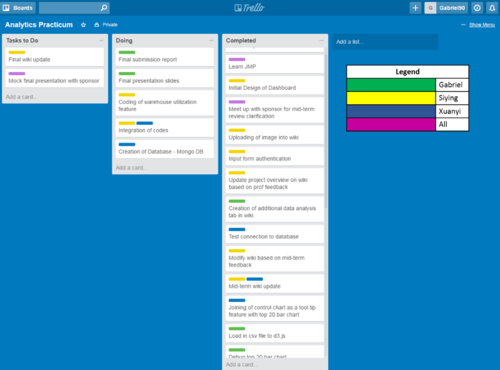
To mitigate the problem, the team switched to Trello Online, a work allocation online platform. The team was aware of Trello as it was used during IS480 - Final Year Presentation. With Trello, this provides an overview of the task that needed to be done, tasks that are in progress and tasks that are completed. The color coding on each tasks also allows team members to be aware of the task handler at the moment. This thus allows team members to have an overview of the project progress, and also prevent any occurrences of duplicated work.
Before - Tableau Desktop
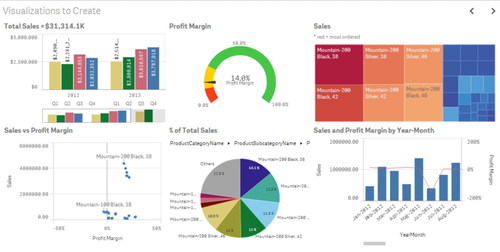
The team’s original goal of the practicum project was to create a dashboard for the sponsor on Tableau. Tableau is a software which allows people with little or no programming background to simply drag and drop data columns to create visualizations to obtain sights. As Tableau was free for existing students, it had come to a common consensus that if the team were able to analyze the data effectively using Tableau the sponsors will send a marketing budget for the purchase of Tableau for future data analyzation. The team had proposed the use of Tableau as it had features which could potentially solve the sponsor’s problems.
- Fast Visualization
- Sponsors will be able to visualize and get insights faster compared to other forms of existing modes like excel.
- Database
- Tableau’s ease of accession to almost all database meant the integration between Tableau and the sponsor’s Warehouse Management Service (WMS) database would have been less of a hassle.
- Learning Curve
- Relatively gentle learning curve for employees with or without technical backgrounds.
- Range of visualization tools
- Provides sponsors with a range of visualization graphs like Tree Maps, Histogram, Box Plot and Gantt chart to choose from.
- Provides sponsors with a range of visualization graphs like Tree Maps, Histogram, Box Plot and Gantt chart to choose from.
After - Web based application
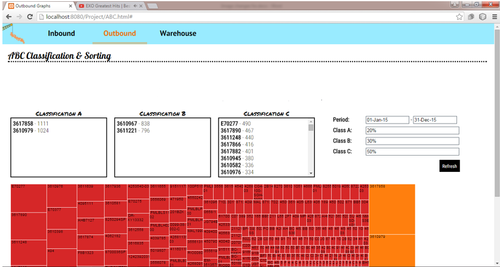
After various discussion and advice from our project supervisor, Prof. Kam, the team decided to switch from Tableau to developing a web based application for the sponsors instead. The analyzation would be done using SAS Enterprise miner and JMP, whereas the data visualization will be done using D3.js. The rationale behind this was due to the following reasons.
- Ease of Integration
- Provides sponsors with the flexibility to incorporate this web based application into their existing WMS instead of a standalone Tableau application where sponsors have to extract and load data into it from their WMS.
- Customization options
- Allows sponsors to customize their application for future incorporation of data learning and predictive features. Using Tableau disallows it as it is unable to host external add on features.
- High costs, limited licenses
- A typical Tableau installation would incur additional costs for the sponsors. $1,999 per license, per year, with a minimum of 10 licenses. As the sponsors would also like its warehouse crews to view the movement and utilization of the warehouse, the costs might be more than expected.
- Long term sustainability
- Having a web application designed specifically for the sponsors ensures long term sustainability as sponsors do not need to depend on external vendors (in the case of Tableau), for support.
- A web application managed internally by the sponsors allows the team’s codes to be replicated for other warehouses even after the practicum project ends.
Before – NetBeans IDE
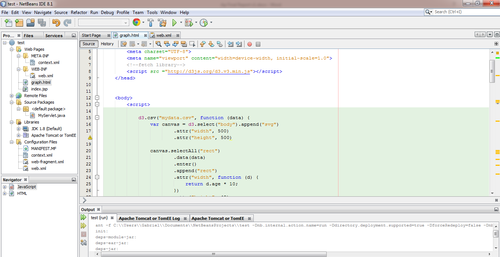
Our team initially used the NetBeans IDE. That is because our team had been using NetBeans since year 2. Thus, we are more familiar with NetBeans. The NetBeans IDE also provide some forms of convenience:
- Pre-configured
- As we have been using NetBeans, the application is already ready and installed in our laptops
- All the necessary servers and services had been installed and started up automatically upon launching NetBeans
- Error Checking
- When we didn’t close the loop or we miss out a curved bracket, NetBeans debugger will alert us on the error.
- When we didn’t close the loop or we miss out a curved bracket, NetBeans debugger will alert us on the error.
After – Notepad++
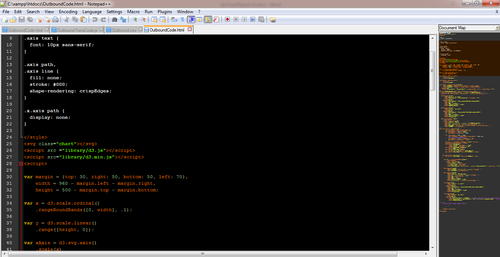
After our discussion with Prof. Kam, the team has decided to opt for a lightweight editor, namely the Notepad++. The reason for doing so is because there are a lot of redundant add-ons when we develop using NetBeans, such as the build.xml. Ideally, we are going to be focusing mainly on the web page interface, which is html centric. The library we will be mainly using, D3.js, only requires an html surface, where Notepad++ more than suffices. With regards to debugging, our group has grown comfortable with using the Chrome debugger. Since it is a web page, being able to debug on the webpage itself aids us in determining the line where the error lies in. Similarly, we can make use of the “Element” option in the debugging tools to check if our CSS is incorrect or if the D3.js code caused some layout issue on CSS.
Before – Excel
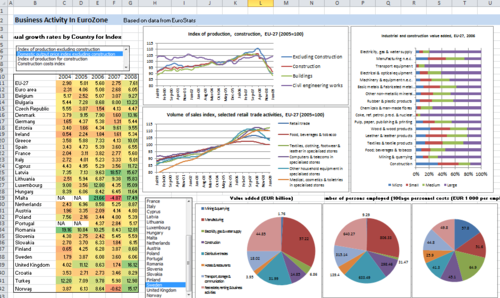
The team’s initial choice of analytical tool was to use excel as we were familiar with its data analysis features such as pivot table, charts and what-if analysis. However, the idea was soon scraped due to several problems faced.
- Slow start up
- The loading of various excel add-ins meant that the startup of excel was slow.
- Slow processing speed
- The loading of excel formulas was often slow due to the huge amount of data.
- Inefficiency of data analysis visualization
- Although excel does allow the team to create data analysis visualization such as box-and-whisker plot, it requires specific steps for the team to follow, which is often time consuming and not straight forward.
- Impractical
- The data given to the team was spread across two excels spreadsheets and it would not be practical to replicate the analysis across the spreadsheets.
- The data given to the team was spread across two excels spreadsheets and it would not be practical to replicate the analysis across the spreadsheets.
After – JMP
500px
After several discussions, the team brainstormed and came to a common consensus to adopt the use of JMP software from SAS. JMP is a software created by SAS for its users to explore data analysis visually, through its visual, interactive, comprehensive and extensible features. As only one of the team had been exposed to JMP before, the team arranged for a meeting for a quick jump start session on the usage of JMP. There were several benefits of using JMP that the team had experienced since the switch from excel to JMP.
- Interactive table and dialog
- Easy drag and drop feature to create a custom table and visualization aid for analysis.
- Default Statistics options
- Allows user to change the default statistics when you drag and drop analysis.
- Option to easily add in additional statistics such as mean, standard deviation, range and quantiles into analysis.
- Learning curve
- Does not require training classes or the learning of a programming language to use JMP efficiently.
- Does not require training classes or the learning of a programming language to use JMP efficiently.
Before – Allocation of data were Disorganized
Prior to the midterm’s submission, members were individually exploring and working on d3.js for their own assigned feature. Hence, organization of data files were not streamlined across the team.
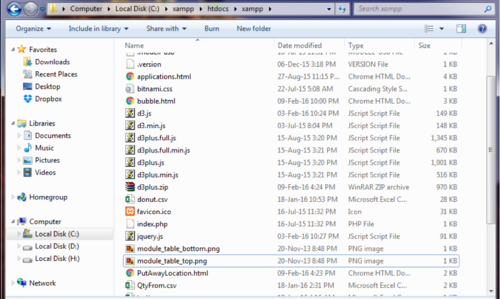
This can be shown in the above folder where there are no form of organization. It was simply a folder to store different data types such as .csv, .js, .html, .css and .png. This was messy and team members had trouble finding the data they wanted as the project grew larger. Integration of code was also a hassle as team hard references to different versions of d3.js libraries.
After – Organized Management of File
The team recognized the problem and created individual sub folders for each category for better organization of data. This ensured quick sharing of data, decreased time needed to find specific files and allowed easier integration and code sharing across members. The libraries needed were also downloaded to ensure that there wouldn’t be an event that the codes will be affected should there be an occurrence of a firmware update.
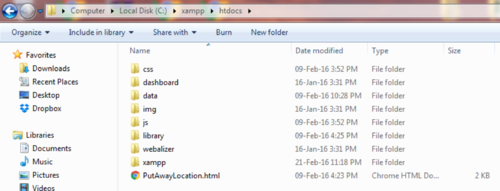
The segmented folders are separated according to their datatype. In this scenario, the css, data, img, js and library folders are used to store the cascading style sheets used, data obtained from the sponsor, images for web application, JavaScript files and d3 libraries respectively. The html files are all stored at the root of the folder as advised by Prof.
For the list of methodology & technology proposed during the proposal stage, please refer to: Team Skulptors - Methodology & Technology