Difference between revisions of "Atom: Analysis"
Sh.yan.2012 (talk | contribs) |
Sh.yan.2012 (talk | contribs) |
||
| Line 59: | Line 59: | ||
We utilized SAS Enterprise Miner, which simplifies time series data mining for huge amounts of data. Additionally Enterprise Miner implements Dynamic Time Warping which is an algorithm for measuring similarity between two times based sequences which might initially vary, Enterprise Miner can identify patterns and similarities by shifting time series against each other. <br> | We utilized SAS Enterprise Miner, which simplifies time series data mining for huge amounts of data. Additionally Enterprise Miner implements Dynamic Time Warping which is an algorithm for measuring similarity between two times based sequences which might initially vary, Enterprise Miner can identify patterns and similarities by shifting time series against each other. <br> | ||
| − | [[File:AtomI05.png|center]] | + | [[File:AtomI05.png|center]]<br> |
| + | |||
| + | ==Dataset== | ||
| + | |||
| + | First we uploaded our transformed data set into the SAS Server and in Enterprise Miner we retrieved this data set and defined the properties for Enterprise Miner to correctly identify the roles of each variable. <br> | ||
| + | [[File:AtomI06.png|center]]<br> | ||
| + | |||
| + | ==Time Series Data Preparation (TSDP)== | ||
| + | |||
| + | TSDP transforms the dataset that is readable by Enterprise Miner, i.e. time stamped data. | ||
| + | |||
| + | ==Multiple Time Series Plot== | ||
| + | [[File:AtomI07.png|center]]<br> | ||
| + | |||
| + | ==TSID Map Table== | ||
| + | [[File:AtomI08.png|center]]<br> | ||
| + | |||
| + | TSID map table shows the original Dataset mapped into different time series and their corresponding Car_Park names. | ||
| + | |||
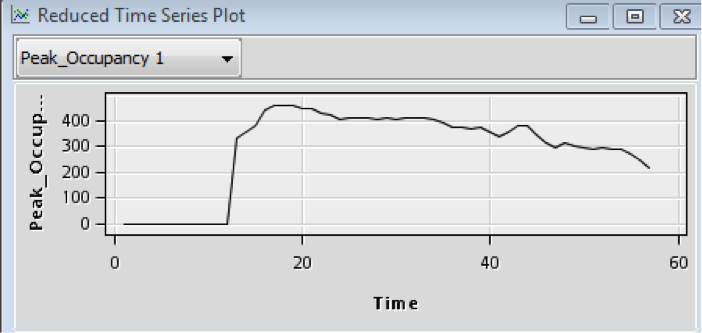
| + | ==Reduced Time Series Plot== | ||
| + | [[File:AtomI09.png|center]]<br> | ||
Revision as of 23:31, 28 February 2016
Interim Analysis
Data Cleaning and Explorations
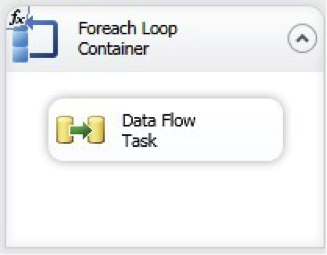
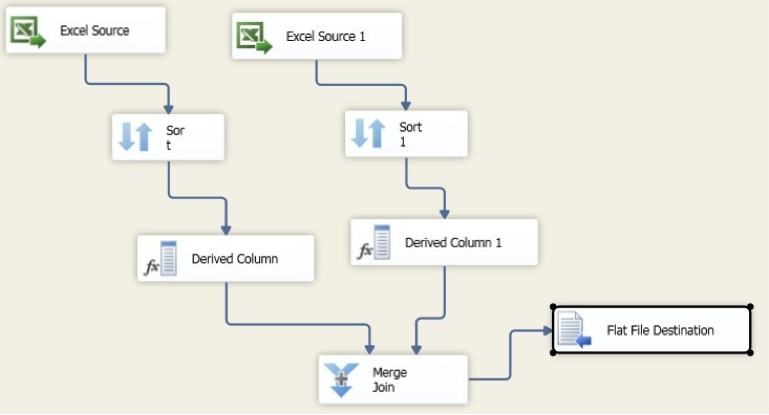
The data we received from MRC was site based and split up into individual excel files with a lot of unnecessary data. After Exploratory Data analysis there is a need to transform the time-based data into appropriately time stamped time series data in order to perform further analysis. For our group we utilized SQL Server Integration Services 2010 to look through all excel files and extract relevant data, as we were comfortable using this software from previous projects.
Filtering and extracting data
There were many variables in the excel sheet that was not helpful for our phase 2 analysis. We have decided on using 6 variables for our analysis, which are the most relevant to what we would like to analyze. The variables are peak_occupancy, non_peak_occupancy, peak_car_in, non_peak_car_in, peak_car_out, non_peak_car_out. We also filtered out 112 Katong as it was a pilot site and there were many missing data.
Combining Data
As the data we received from MRC was site based and split up into individual excel files, there is a need for us to combine all the sites together after filtering and extracting data from individual excel files. This file, includes attributes such as time, car_park, total_lots, peak_occupancy, non_peak_occupancy, peak_car_in, non_peak_car_in, peak_car_out, non_peak_car_out. There are a total of 28 sites that we plan to carry out our analysis.
Recoding Time
As the time given was in ##:##AM/PM format, there was a need for us to recode it into numbers in order for us to run Time Series Analysis on SAS Enterprise Miner. We used SAS Enterprise Guide to recode our time to Time ID starting from 1 before loading the cleaned data into SAS Server.
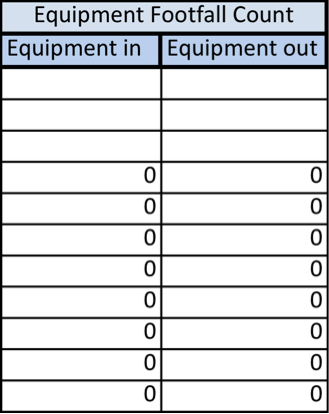
Figure above shows that there are unnecessary rows and columns of data as they are empty. Figure 4 below shows that the recoded data after cleaning has been done.
Initial Approach
Initially our approach was to manually group the parking establishments by region before doing time series analysis. However after we consulted with Professor Kam on Feb 18, the errors of our method was highlighted to us:
The dataset should be telling us what are the groups and patterns instead of us manually deciding how to segregate the data.
Revised Analysis Approach
Time Series Methodology
We utilized SAS Enterprise Miner, which simplifies time series data mining for huge amounts of data. Additionally Enterprise Miner implements Dynamic Time Warping which is an algorithm for measuring similarity between two times based sequences which might initially vary, Enterprise Miner can identify patterns and similarities by shifting time series against each other.
Dataset
First we uploaded our transformed data set into the SAS Server and in Enterprise Miner we retrieved this data set and defined the properties for Enterprise Miner to correctly identify the roles of each variable.
Time Series Data Preparation (TSDP)
TSDP transforms the dataset that is readable by Enterprise Miner, i.e. time stamped data.
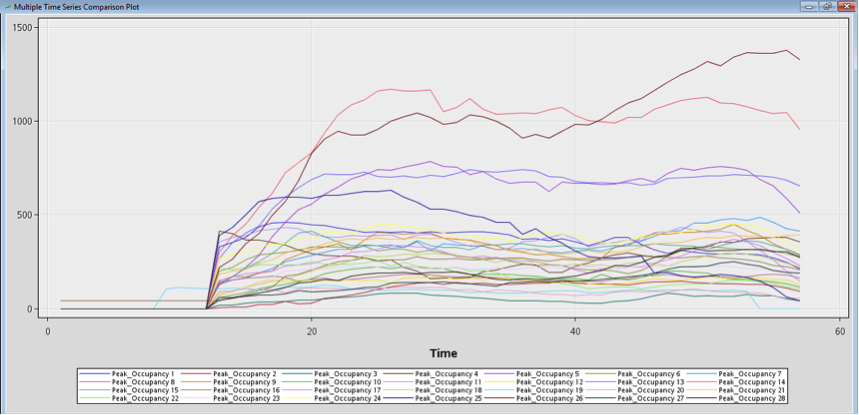
Multiple Time Series Plot
TSID Map Table
TSID map table shows the original Dataset mapped into different time series and their corresponding Car_Park names.

