Difference between revisions of "Improved Decisions for Ocean FreightsAnalysis"
Jump to navigation
Jump to search
(Created page with "<center> <!------- Main Navigation Bar----> {| style="background-color:#ffffff ; margin: 3px auto 0 auto;" width="80%"| | style="font-family:Century Gothic; font-size:15px; te...") |
Mmphang.2012 (talk | contribs) |
||
| Line 22: | Line 22: | ||
<!------- End of Sub Navigation Bar----> | <!------- End of Sub Navigation Bar----> | ||
</center> | </center> | ||
| + | |||
| + | <br /> | ||
| + | |||
| + | {| style="background-color:#ffffff; width:80%; font-family:Century Gothic; font-size:15px; margin: 3px auto 0 auto;" | | ||
| + | | style="background-color:#006600; ; color:#ffffff; text-align: center; border-top:solid #ffffff; border-bottom:solid #ffffff; width:50%; " | | ||
| + | [[Improved_Decisions_for_Ocean_Freights|<span style="color:#ffffff"><strong>No clear relationship between shipper country and utilization rate</strong></span>]] | ||
| + | |- | ||
| + | |<br><center>[[File:UtilizationRatesByShipperCountry.png|1200px]]</center> | ||
| + | |||
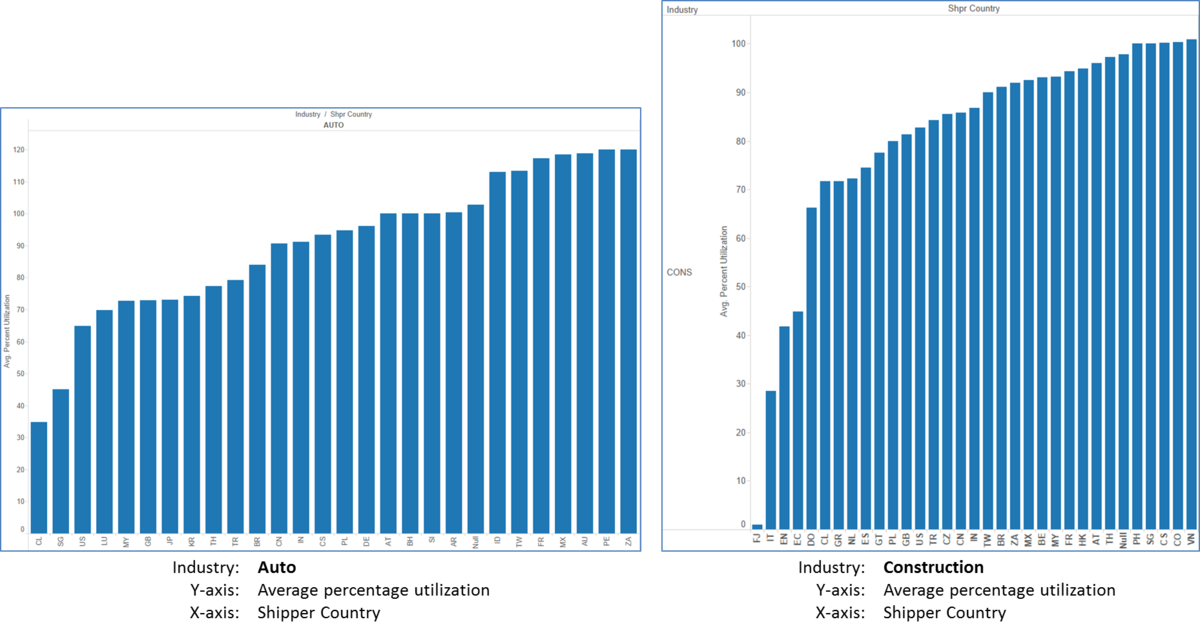
| + | We see from the graph on the left that shipments originating from Chile, Singapore and the United States have the lowest utilization rates. | ||
| + | However, we see from the graph on the right that shipments originating from Fiji, Italy and Estonia have the lowest utilization rates. | ||
| + | As such, we are unable to see a clear relationship between the shipper country and utilization rates. | ||
| + | |||
| + | |} | ||
Revision as of 10:15, 29 September 2015
|
No clear relationship between shipper country and utilization rate |
 We see from the graph on the left that shipments originating from Chile, Singapore and the United States have the lowest utilization rates. However, we see from the graph on the right that shipments originating from Fiji, Italy and Estonia have the lowest utilization rates. As such, we are unable to see a clear relationship between the shipper country and utilization rates. |