Difference between revisions of "REO Project Findings"
Gtong.2014 (talk | contribs) |
Gtong.2014 (talk | contribs) |
||
| Line 104: | Line 104: | ||
Member_Days variable was not included for clustering analysis as the sponsor mentioned that accounts could be mass purchased, thus having the same members day but not exactly indicative of the number of days spent for each agent. <br> | Member_Days variable was not included for clustering analysis as the sponsor mentioned that accounts could be mass purchased, thus having the same members day but not exactly indicative of the number of days spent for each agent. <br> | ||
Therefore, the final four variables selected for cluster analysis are: Sessions, Synced, Cobroke and Enquiries from Consumers. These clustering variables are specific and observable. The descriptions are as follows: | Therefore, the final four variables selected for cluster analysis are: Sessions, Synced, Cobroke and Enquiries from Consumers. These clustering variables are specific and observable. The descriptions are as follows: | ||
| − | <br>[[File:REO_table4.png| | + | <br>[[File:REO_table4.png|600px]] |
<br>Before the clustering analysis was conducted, observations with no sessions over the past six months were removed. These users are likely to have abandoned the usage of the portal and thus, meaningful observations are unlikely to surface from studying them through the current dataset. With their removal using the data filter, 7895 observations were excluded from the initial 20762. These observations will be grouped in Cluster Number 0 as abandoned users. | <br>Before the clustering analysis was conducted, observations with no sessions over the past six months were removed. These users are likely to have abandoned the usage of the portal and thus, meaningful observations are unlikely to surface from studying them through the current dataset. With their removal using the data filter, 7895 observations were excluded from the initial 20762. These observations will be grouped in Cluster Number 0 as abandoned users. | ||
| − | <br>[[File:REO_fig4.png| | + | <br>[[File:REO_fig4.png|600px]] |
<br>All continuous variables’ distributions were reviewed to check for spread of the data. As seen above, the variables are highly skewed. Therefore, transformation was to be conducted through the global Johnson transformation option in cluster analysis. As the range of values for each of the variables were reasonably close, there was no need for standardization. | <br>All continuous variables’ distributions were reviewed to check for spread of the data. As seen above, the variables are highly skewed. Therefore, transformation was to be conducted through the global Johnson transformation option in cluster analysis. As the range of values for each of the variables were reasonably close, there was no need for standardization. | ||
| − | <br>[[File:REO_fig5.png| | + | <br>[[File:REO_fig5.png|600px]] |
<br>After conducting the global transformation, the observations appear to follow more of a normal distribution curve. However, it is evident that the Global Johnson Transformation did not fully resolve the outlier issues. | <br>After conducting the global transformation, the observations appear to follow more of a normal distribution curve. However, it is evident that the Global Johnson Transformation did not fully resolve the outlier issues. | ||
Revision as of 15:00, 16 April 2018
| Data Preparation | Exploratory Data Analysis | Cluster Analysis |
As the data were received in separated sheets, it is necessary to perform some transformation before they are ready for deeper analysis. The team are not able to analyse these raw data files as the system logs are too specific.
Therefore, the objective of the data preparation is to convert the system logs into an intermediary stage where it analysis of value can be done easily while retaining sufficient meaning.
For Exploratory Data Analysis
For Data File Users,
- Created “Members_Days” variable by counting the number of days passed by 31 Dec 2017 since the account was created. With the new variable, the team can analyse whether being a member for a longer time has impact on other factors.
- Removal of users who joined after 31st December 2017 as they do not have at least 2 quarters of data available for analysis.
- 152 (0.66%) Users who were previously labelled as “blacklisted” in the dataset are removed from analysis due to their restricted activity level.
For Data File Sessions,
- Tabulating the data by each “user_id”
- Created “hours” column to convert the “created_date” into their respective hours (0 as 12am to 23 as 11pm).
- Created “month” to convert the “created_date” into their respective month from July to December 2017.
- Created “day_of_week” to convert the “created_date” into 1 to 7, representing Sunday to Saturday respectively.
- Include “plan” column from Subscription file.
For Data File Listings,
- Tabulated the data by each “user_id”
- Created “hours” column to convert the “created_date” into their respective hours (0 as 12am to 23 as 11pm).
- Created “month” to convert the “created_date” into their respective month from July to December 2017.
- Created “day_of_week” to convert the “created_date” into 1 to 7, representing Sunday to Saturday respectively.
- Tabulated the data by each “users_id” and “source_type” as columns
- Include “plan” column from Subscription file.
For Data File Cobroke,
- Tabulating the data by each “user_id”
- Include “plan” column from Subscription file.
- Created “month” to convert the “created_date” into their respective month from July to December 2017.
For Data File Enquiries,
- Tabulated the data by each “user_id”
- Tabulated the data by each “user_id” and “enquiries_type” as columns
- Include “plan” column from Subscription file.
- Created “month” to convert the “created_date” into their respective month from July to December 2017.
For Clustering Analysis
Step 1:
For “Users” file, date joined was converted to membership length with REO based on the number of days. While the other original files recorded their activity levels, the logs data were collapsed into individual count for each user as an aggregated number. For “Listing” and “Enquiries” files, an user can post both forms of listings as well as receive different kinds of enquiries, showing that they are not mutually exclusive unlike plan. As such, “Listing” and “Enquiries” files were separated into two different variables.
Step 2:
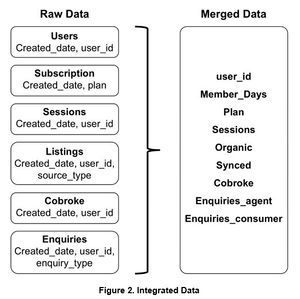
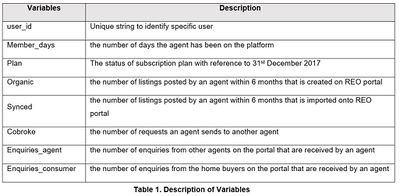
The files were merged into rows separated by a unique user_id. First, we have each user’s membership length and the status of their subscription plan. All the other activities count for each user were subsequently merged with a total of 20,762 users. The merged dataset contains these variables: sessions, organic listings, synced listings, cobroke, enquiries from agents and enquiries from consumers.
Step 3:
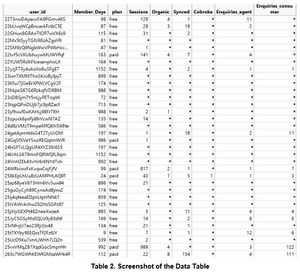
As missing values indicate a lack of activity recorded, it could be represented by “0”. Recording missing values as zero is crucial because cluster analysis would exclude rows with missing values.
Choice of Users
The choice of users is not narrowed down to the type of plan they use because depending on their user behavior, they have potential to be retained if they are paid users or converted if they are free users. As the objective is to identify segments to improve engagement, we do not differentiate paid or free users in clustering analysis.
Variables Selection for Clustering Analysis

As clustering analysis is an unsupervised method, it is necessary to consider all initial variables and eliminate them as inputs with reasons. Multivariate analysis was conducted for all variables. We found that “Sessions” and “Organic listings” (r = 0.9065), “Enquiries_agent” and “Enquiries_consumer” (r = 0.7344) have a correlation coefficient of above 0.7. This meant that the two pairs of variables are strongly correlated. From a statistical perspective, to prevent overrepresentation in cluster analysis, one variable from each offending pair needs to be dropped.
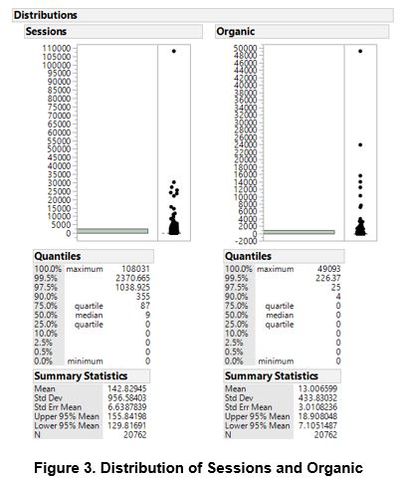
The variable Organic was dropped from selections in favour for Sessions variable as the variable is even more skewed as indicated by the quantiles value from the figure below.
Enquiries from Agent were dropped in favour of Enquiries from Consumer as well. This decision was arrived at with the input from the sponsor, who indicated that there were a significant proportion of unwanted enquiries or “spam” from agents to agents. From a business perspective, this variable might be poorer at representing actual commercial interests as compared to enquiries from consumers.
Member_Days variable was not included for clustering analysis as the sponsor mentioned that accounts could be mass purchased, thus having the same members day but not exactly indicative of the number of days spent for each agent.
Therefore, the final four variables selected for cluster analysis are: Sessions, Synced, Cobroke and Enquiries from Consumers. These clustering variables are specific and observable. The descriptions are as follows:

Before the clustering analysis was conducted, observations with no sessions over the past six months were removed. These users are likely to have abandoned the usage of the portal and thus, meaningful observations are unlikely to surface from studying them through the current dataset. With their removal using the data filter, 7895 observations were excluded from the initial 20762. These observations will be grouped in Cluster Number 0 as abandoned users.
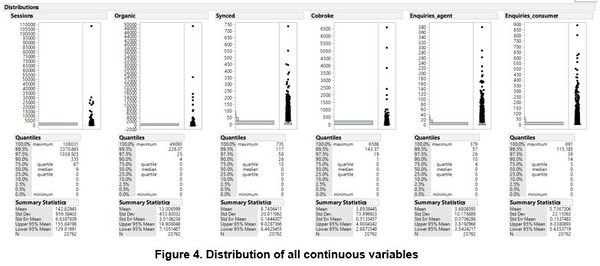
All continuous variables’ distributions were reviewed to check for spread of the data. As seen above, the variables are highly skewed. Therefore, transformation was to be conducted through the global Johnson transformation option in cluster analysis. As the range of values for each of the variables were reasonably close, there was no need for standardization.
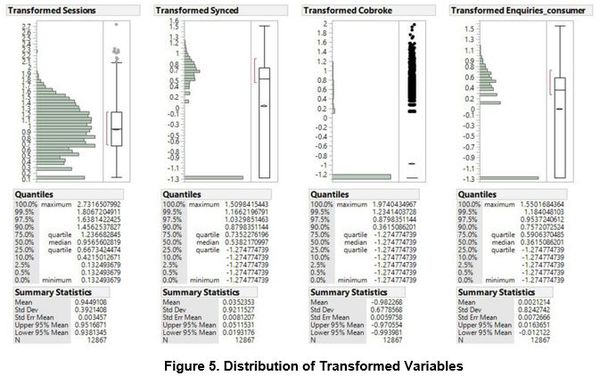
After conducting the global transformation, the observations appear to follow more of a normal distribution curve. However, it is evident that the Global Johnson Transformation did not fully resolve the outlier issues.