Difference between revisions of "Maximum Project Findings"
| Line 37: | Line 37: | ||
<br/><div align="left"> | <br/><div align="left"> | ||
| − | <div style="background: #F5FFFA; padding: 12px; font-family: Arimo; font-size: 18px; font-weight: bold; line-height: 1em; text-indent: 15px; border-left: #4AB6A6 solid 32px;"><font color="#4AB6A6">Data Cleaning</font></div> | + | <div style="background: #F5FFFA; padding: 12px; font-family: Arimo; font-size: 18px; font-weight: bold; line-height: 1em; text-indent: 15px; border-left: #4AB6A6 solid 32px;"><font color="#4AB6A6">Data Cleaning and Preparation</font></div> |
<br/> | <br/> | ||
| − | The pre-survey dataset had 1,455 records, and the post-survey dataset had 414 records. On merging, we only had 292 records where the pre | + | The pre-survey dataset had 1,455 records, and the post-survey dataset had 414 records. On merging, we only had 292 records where the pre and post surveys were both done by the respondents. |
| − | We | + | We conducted the following cleaning procedures: |
* Irrelevant and Duplicate Fields: Removed from our dataset. | * Irrelevant and Duplicate Fields: Removed from our dataset. | ||
* Missing Data: Removed from our data set, null values were replaced with 0s to facilitate our analysis. | * Missing Data: Removed from our data set, null values were replaced with 0s to facilitate our analysis. | ||
| − | * Rectifying Discrepancies: Ensured data from pre | + | * Rectifying Discrepancies: Ensured data from pre and post survey were in comparable formats. |
| − | * Data Transformation: Transformed | + | * Data Transformation: Transformed pre-survey training questions to numerical format. |
| − | * Standardisation: Standardised | + | * Standardisation: Standardised naming conventions for the variables in the merged data. |
| + | |||
| + | We conducted the following preparation procedures: | ||
| + | |||
| + | * Exploratory Data Analysis: Created calculated fields for divergent bar charts | ||
| + | * Chi-squared tests: Split the data into different skills | ||
| + | * Text Analysis: Comments were transformed to show unique words and their frequencies | ||
<br/><div align="left"> | <br/><div align="left"> | ||
<div style="background: #F5FFFA; padding: 12px; font-family: Arimo; font-size: 18px; font-weight: bold; line-height: 1em; text-indent: 15px; border-left: #4AB6A6 solid 32px;"><font color="#4AB6A6">Data Exploration</font></div> | <div style="background: #F5FFFA; padding: 12px; font-family: Arimo; font-size: 18px; font-weight: bold; line-height: 1em; text-indent: 15px; border-left: #4AB6A6 solid 32px;"><font color="#4AB6A6">Data Exploration</font></div> | ||
<br/> | <br/> | ||
| − | + | ||
| + | 1. Percentage of students who received training in library research skills | ||
| + | |||
| + | {| class="wikitable" width="50%" | ||
| + | |- | ||
| + | ! Skill!!Highest Majority!! Lowest Majority | ||
| + | |- | ||
| + | |<center>Citing References</center> ||<center>SOSS students (78.05%)</center> || <center>SOL students (54.84%)</center> | ||
| + | |- | ||
| + | |<center>Creating Reference Lists</center> ||<center>SOSS students (68.29%)</center> || <center>SIS students (43.33%)</center> | ||
| + | |- | ||
| + | |<center>Searching the Internet using Google</center> ||<center>SIS students (76.67%)</center> || <center>SOL students (58.06%)</center> | ||
| + | |- | ||
| + | |<center>Searching using Keywords</center> ||<center>SIS students (83.33%)</center> || <center>SOE students (57.89%)</center> | ||
| + | |- | ||
| + | |<center>Evaluating Information</center> ||<center>SIS students (70%)</center> || <center>SOL students (38.71%)</center> | ||
| + | |- | ||
| + | |<center>Scoping your Topic</center> ||<center>SOA students (70%)</center> || <center>SOL students (48.39%)</center> | ||
| + | |- | ||
| + | |<center>Searching using Library Online Databases</center> ||<center>SIS students (83.33%)</center> || <center>SOE students (50%)</center> | ||
| + | |} | ||
| + | <br/> | ||
| + | |||
| + | |||
| + | 2. Effect of Training of Confidence Levels | ||
| + | |||
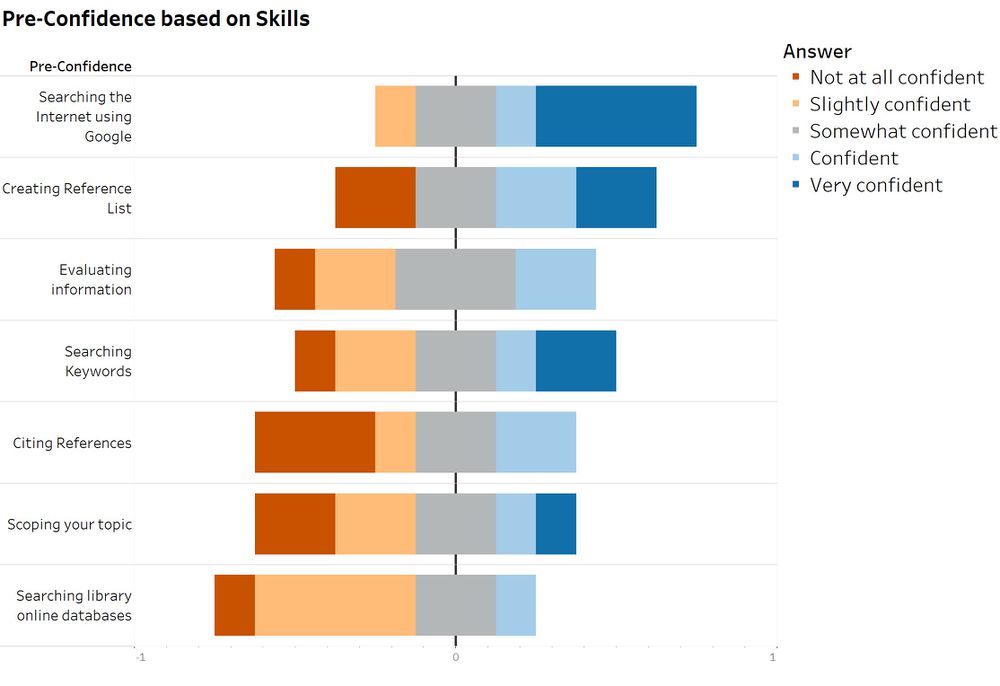
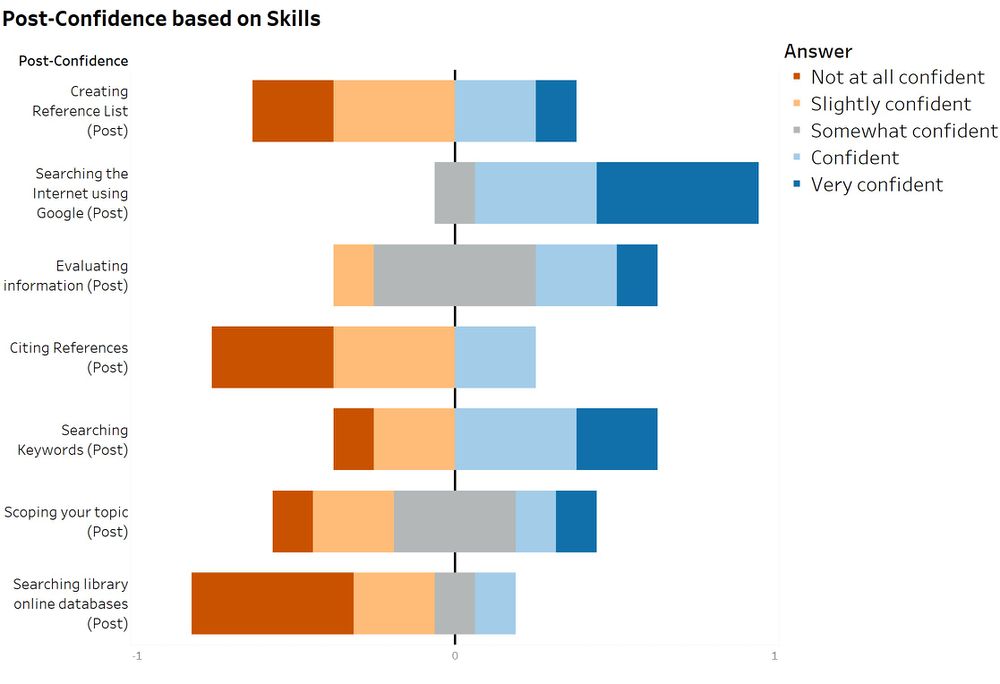
| + | Confidence level before and after the semester of SMU students who did not receive any training in conducting overall library research skills: | ||
| + | |||
| + | <center> | ||
| + | [[Image:Team20_Graph1.jpg|1000px]] | ||
| + | </center> | ||
| + | <br/> | ||
| + | |||
| + | <center> | ||
| + | [[Image:Team20_Graph2.jpg|1000px]] | ||
| + | </center> | ||
| + | <br/> | ||
| + | |||
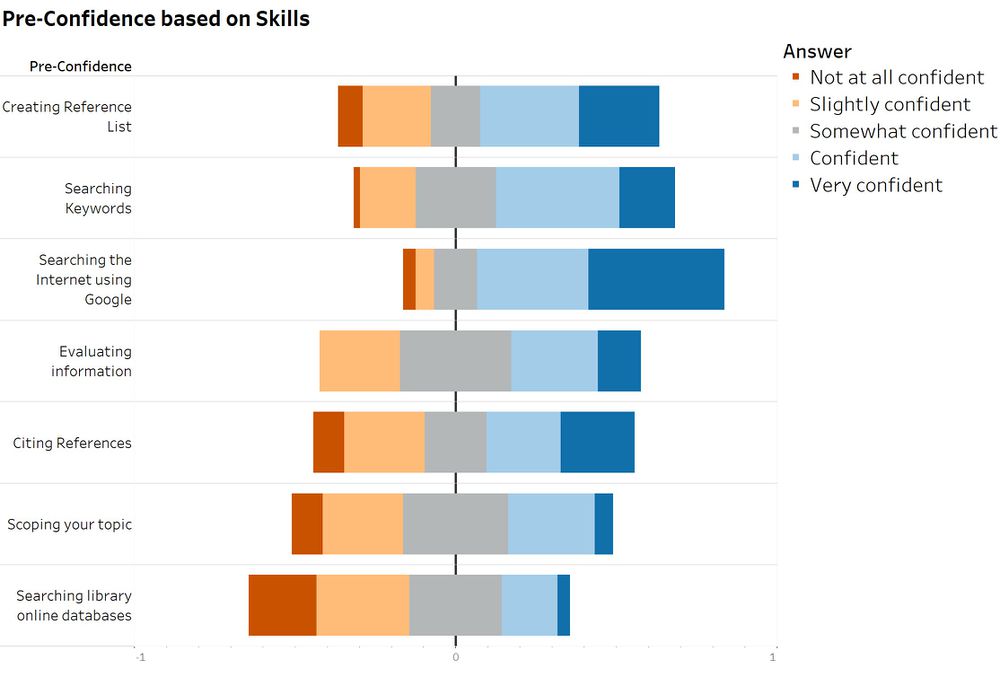
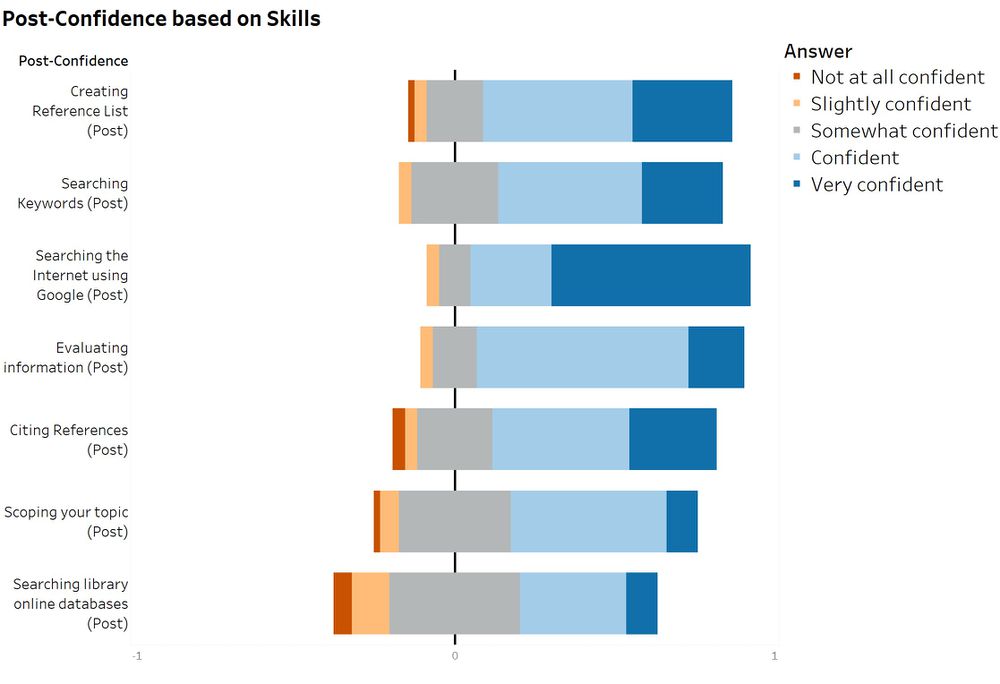
| + | Confidence level before and after the semester of SMU students who received training in conducting overall library research skills: | ||
| + | |||
| + | <center> | ||
| + | [[Image:Team20_Graph3.jpg|1000px]] | ||
| + | </center> | ||
| + | <br/> | ||
| + | |||
| + | <center> | ||
| + | [[Image:Team20_Graph4.jpg|1000px]] | ||
| + | </center> | ||
| + | <br/> | ||
<br/><div align="left"> | <br/><div align="left"> | ||
| Line 58: | Line 112: | ||
<br/> | <br/> | ||
| − | + | Divergent Stacked Bar Graphs: | |
Visualisations give quick insights from data, allowing targeted analysis. For Likert data, using divergent stacked bar graphs is especially appropriate. It facilitates a visual comparison of respondents’ answers to the survey (Heiberger and Robbins, 2011). For our purpose, divergent stacked bar graphs allow us to see the general levels of confidence for the different research skills. By comparing the graphs using pre and post confidence data, we can understand whether there was an improvement in the responses. | Visualisations give quick insights from data, allowing targeted analysis. For Likert data, using divergent stacked bar graphs is especially appropriate. It facilitates a visual comparison of respondents’ answers to the survey (Heiberger and Robbins, 2011). For our purpose, divergent stacked bar graphs allow us to see the general levels of confidence for the different research skills. By comparing the graphs using pre and post confidence data, we can understand whether there was an improvement in the responses. | ||
| − | + | Chi-Squared Tests for Independance: | |
To statistically determine whether the change, specifically improvements, in confidence were significant, the chi-squared test for independence was used. The chi-squared tests allow for us to conclude whether the distribution of the categorical variable (confidence) is related to the variable of our groups (training) (Kim, 2017). | To statistically determine whether the change, specifically improvements, in confidence were significant, the chi-squared test for independence was used. The chi-squared tests allow for us to conclude whether the distribution of the categorical variable (confidence) is related to the variable of our groups (training) (Kim, 2017). | ||
There is ongoing debate as to the appropriateness of a chi-squared test on paired data. Some discuss using paired t-test or Wilcoxon test when working with paired data (Derrick and White, 2017). However, these approaches assume an equal spacing between the categories on the Likert scale, which is spurious for the confidence categories in our data. Furthermore, in conducting the chi-squared analysis, we obtain contingency tables that help us see detail in any improvements in confidence. | There is ongoing debate as to the appropriateness of a chi-squared test on paired data. Some discuss using paired t-test or Wilcoxon test when working with paired data (Derrick and White, 2017). However, these approaches assume an equal spacing between the categories on the Likert scale, which is spurious for the confidence categories in our data. Furthermore, in conducting the chi-squared analysis, we obtain contingency tables that help us see detail in any improvements in confidence. | ||
| − | + | Word Frequency Analysis: | |
Text comments from the end of the survey can be analysed to find out respondents’ concerns not captured by the survey. This is done with the underlying assumption words that appear more frequently indicate an issue that students care more about (Stemler, 2001). | Text comments from the end of the survey can be analysed to find out respondents’ concerns not captured by the survey. This is done with the underlying assumption words that appear more frequently indicate an issue that students care more about (Stemler, 2001). | ||
Revision as of 02:06, 10 April 2018
The pre-survey dataset had 1,455 records, and the post-survey dataset had 414 records. On merging, we only had 292 records where the pre and post surveys were both done by the respondents.
We conducted the following cleaning procedures:
- Irrelevant and Duplicate Fields: Removed from our dataset.
- Missing Data: Removed from our data set, null values were replaced with 0s to facilitate our analysis.
- Rectifying Discrepancies: Ensured data from pre and post survey were in comparable formats.
- Data Transformation: Transformed pre-survey training questions to numerical format.
- Standardisation: Standardised naming conventions for the variables in the merged data.
We conducted the following preparation procedures:
- Exploratory Data Analysis: Created calculated fields for divergent bar charts
- Chi-squared tests: Split the data into different skills
- Text Analysis: Comments were transformed to show unique words and their frequencies
1. Percentage of students who received training in library research skills
| Skill | Highest Majority | Lowest Majority |
|---|---|---|
2. Effect of Training of Confidence Levels
Confidence level before and after the semester of SMU students who did not receive any training in conducting overall library research skills:
Confidence level before and after the semester of SMU students who received training in conducting overall library research skills:
Divergent Stacked Bar Graphs: Visualisations give quick insights from data, allowing targeted analysis. For Likert data, using divergent stacked bar graphs is especially appropriate. It facilitates a visual comparison of respondents’ answers to the survey (Heiberger and Robbins, 2011). For our purpose, divergent stacked bar graphs allow us to see the general levels of confidence for the different research skills. By comparing the graphs using pre and post confidence data, we can understand whether there was an improvement in the responses.
Chi-Squared Tests for Independance: To statistically determine whether the change, specifically improvements, in confidence were significant, the chi-squared test for independence was used. The chi-squared tests allow for us to conclude whether the distribution of the categorical variable (confidence) is related to the variable of our groups (training) (Kim, 2017). There is ongoing debate as to the appropriateness of a chi-squared test on paired data. Some discuss using paired t-test or Wilcoxon test when working with paired data (Derrick and White, 2017). However, these approaches assume an equal spacing between the categories on the Likert scale, which is spurious for the confidence categories in our data. Furthermore, in conducting the chi-squared analysis, we obtain contingency tables that help us see detail in any improvements in confidence.
Word Frequency Analysis: Text comments from the end of the survey can be analysed to find out respondents’ concerns not captured by the survey. This is done with the underlying assumption words that appear more frequently indicate an issue that students care more about (Stemler, 2001).
- Derrick, B. and White, P. (2017) Comparing two samples from an individual Likert question. International Journal of Mathematics and Statistics, 18 (3). ISSN 0974-7117 http://eprints.uwe.ac.uk/30814
- Heiberger M., Robbins, N B. (2011). Plotting Likert and Other Rating Scales. Proceedings of the 2011 Joint Statistical Meeting
- Kim HY. (May 2017). Statistical notes for clinical researchers: Chi-squared test and Fisher's exact test. Restor Dent Endod. 42(2):152-155. https://doi.org/10.5395/rde.2017.42.2.152
- Stemler, Steve. (2001). An overview of content analysis. Practical Assessment, Research & Evaluation, 7(17). http://PAREonline.net/getvn.asp?v=7&n=17


