Difference between revisions of "ANLY482 AY2017-18T2 Group13 Analysis & Findings"
Jhpark.2014 (talk | contribs) |
Jhpark.2014 (talk | contribs) |
||
| Line 213: | Line 213: | ||
Next to confirm any observations, a non-parametric ANOVA test –“Kruskal-Wallis”Test to confirm was conducted in each case using JMP Pro 13. (A non-parametric test was used since we were unable to confirm a normal distribution in our data.) While a number of tests were avilable for the comparison of independent samples with different sample sizes,“Kruskal-Wallis”Test was chosen over other tests such as Wilcoxon test was because it could accommodate more groups as compared to the latter. | Next to confirm any observations, a non-parametric ANOVA test –“Kruskal-Wallis”Test to confirm was conducted in each case using JMP Pro 13. (A non-parametric test was used since we were unable to confirm a normal distribution in our data.) While a number of tests were avilable for the comparison of independent samples with different sample sizes,“Kruskal-Wallis”Test was chosen over other tests such as Wilcoxon test was because it could accommodate more groups as compared to the latter. | ||
| + | |||
The set-up of this Kruskal-Wallis test is the following: <br/><br/> | The set-up of this Kruskal-Wallis test is the following: <br/><br/> | ||
| − | - H0: Null hypothesis, meaning no difference in the medians across 5 years | + | - H0: Null hypothesis, meaning no difference in the medians across 5 years<br/> |
| − | - H1: Alternative hypothesis, meaning statistically significant that the at least one of the medians are different from the rest | + | - H1: Alternative hypothesis, meaning statistically significant that the at least one of the medians are different from the rest<br/> |
| − | - Reject null hypothesis if p-value < 0.05 = α (95% confidence) | + | - Reject null hypothesis if p-value < 0.05 = α (95% confidence)<br/> |
Revision as of 00:47, 28 February 2018
Contents
Manipulation and Cleaning of Training Records
In order to rectify these missing data points, we replaced the values whenever possible as the team hopes to analyze as many data points as possible. When replacement of values are not possible, records are excluded from analysis.
| Missing data (Field) | Action |
|---|---|
| Start and End date | 1. Attempted to find corresponding dates from exact course titles, unsuccessful
2. Attempt to take 'Create date' however inaccurate as record could have been created after actual start and end date 3. Excluded (Final action) |
| Category | Replaced missing data with corresponding records with exact course title |
Groupings within Training Records
Course Titles Groupings
Using text explorer and vetting through our Sponsor, course titles were grouped in order to narrow down our analysis to specific areas. Grouping was done with a calculated field to facilitated breakdown analysis in later stage.
Groupings :
- Bulk
- HSEQ
- Equipment and Maintenance
- Miscellaneous
- Packaging
- Packaging and Raw Material
- Warehouse
- Others
Staff Department Groups
Staff department groupings (refer to Groupings within Staff Records) were also applied in Training Records.
Manipulation and Cleaning of Staff List
1. As the staff list provided were in separate sheets, data fields were standardized and merged into 1 data set.
| Previous field name | New field name | Sheet affected |
|---|---|---|
| Job Code | Job Title | Dec'13 & Dec '14 |
| Job Group | Staff Group | Dec'14 |
| Designation | Job Title | Dec'15, Dec'16, Dec'17 |
| Staff Grade | Staff Group | Dec'15, Dec'16, Dec'17 |
| Section | Department | Dec'15, Dec'16, Dec'17 |
| Department | Location | Dec '14, Dec'15, Dec'16, Dec'17 |
2. Standardization of variables within columns were also made to ensure consistency throughout the years.
| Issue | Action taken | Sheet affected |
|---|---|---|
| Location column missing from sheets and location information was combined in the naming assigned to the departments (e.g. X7000) | Location Group column created to extract the front letters from the department in Excel with a calculated field | Dec'13 & Dec '14 |
| Department variables inconsistent with other years as it was combined with location. Other sheets used a single descriptive field to specify departments (e.g. X Shared Services) [SNAPSHOT] | Used corresponding descriptive department name based on matching of employee number to other sheets | Dec’13 & Dec'14 |
| Variables as Job Title was inconsistent with other years and were in the form of acronyms | Cross referenced employee number to other years and Training Records for corresponding job title | Dec'13 & Dec ‘14 |
| Variables in Cost Centre , Citizenship and Serial Number fields were inconsistent over the years (e.g. Missing entire field) and had missing records that could not be matched with other years | As these fields were not within the scope and were advised by the Sponsor to exclude, these fields were excluded from the data analysis entirely | Dec'13, Dec'14, Dec'17 |
Groupings within Staff Records
As provided by the Sponsor, staff departments were grouped into the following :
- Bagging
- CSR
- Operations
- Technical
- Towhead
- Transport
- Warehouse
- Others: Includes all other departments not belonging to either of the above
Mapping Staff List and Training Record data set
Employee number is unique to each employee hence it was used an identifier. While a left join was considered, a full outer join was used instead to include all the records from both data sets independent from whether there were matching employee numbers.
As distinct count of employees in the Training Record is greater than that in the Staff List, the team attributed this to the fact that there are employees who received training but left in the short term to be captured in the Stall List records.
A full outer join would : - Include employees who undergone training but left the company in a short term hence will not be traceable in the annual Staff List - Include employees who did not undergo training However, with a full outer join, crucial fields such as employee number, location etc will be duplicated and may present differing variables. Meanwhile, employee records who appeared in staff list but not training records would have null values in training employee fields.
[Screenshot of tableau]
As such additional columns were created generalize columns that combined data from both sets
1.Employee Number
2.Location Group Filter
3.Staff Department Group Filter
Created to first obtain the department group information from the Training Records, if it is unavailable, information from the Staff List would be used.
4.Job Title Group Filter
Upon mapping, discrepancies in the staff department groups were found. Since employees underwent training based on the job title that they are categorized for training purposes,job title group in Training Records took precedence over job title group in Staff Records.
Parameters
Parameter "Employee Turnover Year" was generated to separate yearly data of Staff List and Training Records. Data for each year comprises of the previous year's December Staff List (as the list at start), the Staff List of the year (as the list at end), and the Training Record of the year.
Data Exploration
Employee Retention
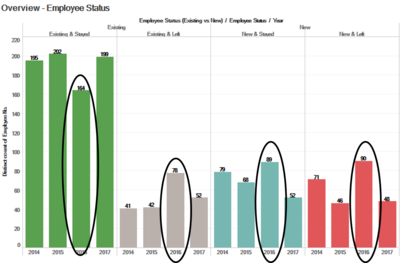
Every year, new ground workers are hired in which they either stay in the company or leave the company. Each year total employee headcount consist of existing and new employees based on the date they joined the company. The status of each employee can be further broken down into stayed (employees who stayed onto the next year) and left (employees who did not stay on to the next year) by cross referencing the year to year staff list.
On average, XYZ Company comprise of around 300 employees yearly who assumes the role of an operator or technician. The overall trend over the four years was that increasing number of existing employees left the company. The data also indicates high employee turnover with a higher percentage of new employees who left the company within the same year of around 45% in each year.
In 2016, the company recorded the lowest number of existing employees who stayed at 164 employees (67%) and the highest number of existing employees who left (79 from previous year) across the 4 years. Nonetheless, the highest number of new hires (179) was recorded in the same year. However, in 2016, half of the new hires left the company within the same year, bringing the total number of employees who left to 168 , which was 50% of total staff headcount at the start of 2016.
XX Business Unit
XX business unit showed similar fluctuation to that of the company level in employee retention, due to greater number of employees in this business unit. The overall yearly employee composition was highly affected and reflected by the fluctuations seen in this business unit.
YY Business Unit
YY business unit showed decreasing number of new employees from 2015 to 2017 and an increasing number of employee retention (Existing & stayed). This reflected better management in YY business unit to retain existing employees over the years instead of hiring new employees. Based on these trends, our team concluded that YY business unit had achieved better human resource management since such trend could reduce wastage in training and hiring processes.
Distribution of Average Training Placement and Hours
Methodology
To gather insights regarding the training distribution among employees, we computed average of training placement count and average training hours by employee, utilized box-and-whisker plots to examine distribution patterns and medians across the years.
Next to confirm any observations, a non-parametric ANOVA test –“Kruskal-Wallis”Test to confirm was conducted in each case using JMP Pro 13. (A non-parametric test was used since we were unable to confirm a normal distribution in our data.) While a number of tests were avilable for the comparison of independent samples with different sample sizes,“Kruskal-Wallis”Test was chosen over other tests such as Wilcoxon test was because it could accommodate more groups as compared to the latter.
The set-up of this Kruskal-Wallis test is the following:
- H0: Null hypothesis, meaning no difference in the medians across 5 years
- H1: Alternative hypothesis, meaning statistically significant that the at least one of the medians are different from the rest
- Reject null hypothesis if p-value < 0.05 = α (95% confidence)
XX Business Unit
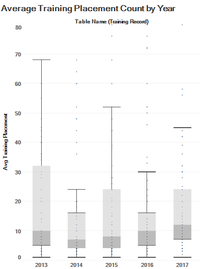
The box plots for XX business unit showed a left-skew in its distributions indicating a large number of the employees in the business unit went below 10 training placements in a year. The median of the average training placement count increased gradually from 7.5 in 2014 to 12 in 2017, reflecting that employees attended more and more training placements than the previous years.
Upon conducting the Kruskal-Wallis test, a p-value of 0.05 was reported. This value is the same as α = 0.05, meaning that it is just on the boundary of tolerance level. Our null hypothesis was not rejected, and we are 95% confident that there is no significant difference between the medians of the 5 years, even though some of the years displayed spread of observations and outliers.
YY Business Unit
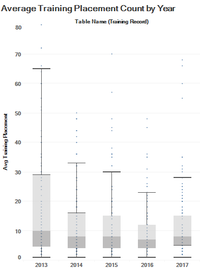
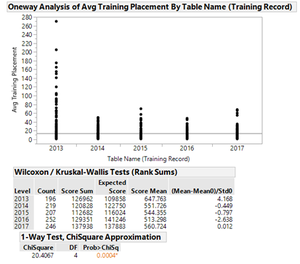
All the boxplots are left-skewed (towards bottom), meaning that the majority of the employees attended small number (fewer than 10) of training placements on average. The box plot distribution plotted for average training placement count in 2013 indicated outliers with extreme values up to 200 that were out of range from 1.5 times of the IQR (25 and 75 percentile). Taking into consideration for visibility, the y-axis was restricted to 80. The median of average training placement count (indicated by the line between the grey and light grey area) were consistent across the 5 years, around 8-10 placements.
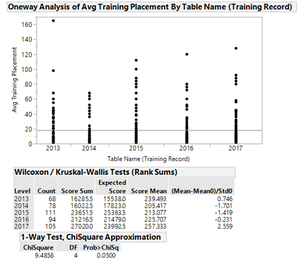
As seen in the above test report generated by JMP, the p-value (0.0004) was less than 0.05. Therefore, we rejected the null hypothesis and concluded that there is significant difference between the medians of five years. Since the Kruskal-Wallis Test did not indicate the observation groups that had different medians, we run a subsequent test called “Dunn Test” to identify those groups.
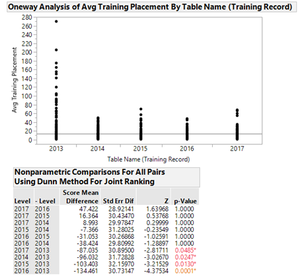
Taking a more conservative approach, a Dunn test is a follow up to a non-parametric test that can be used to identify it specific means are significant from the others 1. The null hypothesis for the test would be that there is no difference between groups while the alternate hypothesis would be vice versa.
The test reported that all the computed p-values for the pair comparisons of each year with 2013 were smaller than 0.05 (p-values coloured in yellow and red), meaning that the median in 2013 was different from the rest of the years. Therefore, we conclude that the employees attended significantly higher number of training placements in 2013 than in any other years; and from 2014 to 2017, they attended more or less the same number of training placement on average.
Wastage of resources on New Hires
As observed from yearly employee retention, the company experiences high employee turnover. Training of new hires who leave within the short term can result in course expenditure and wastage of resources to conduct these training since these employees would not have contributed enough to the company performance before leaving. Hence, we conduct an analysis of training records for new employees who leave within the year they were employed, using the comparison of Join Date and Leave Date.
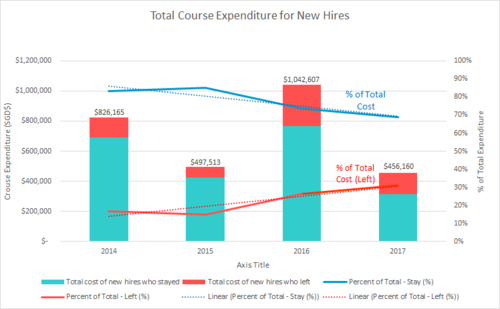
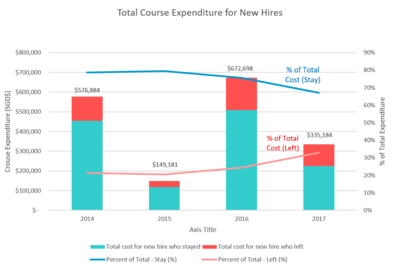
In 2017, course expenditure incurred increased by 28% as compared to expenditure in 2013. However this was with exception of the year 2016 where XYZ Company saw the highest course expenditure for new hires incurred ($557,281), which was 2 times of the expenditure in the previous year. Total cost expenditure incurred for new hires who left accounted for half of the yearly total expenditure across 5 years.
YY Business Unit
Course expenditure for new hires who left from Y increased tremendously after 2013 ($20,987). It peaked in 2016 ($233,644) before showing significant decrease in 2017 ($71,676). This wasted expenditure accounted 36% to 48% of overall course expenses for new hires between 2014 and 2017 with an exception for 2013 (69%). While this wasted expenditure accounted for smaller portions of the total expenditure yearly as compared to course expenses for new hires who stayed on, total expenditure incurred for new hires who left the company amounted to a total sum of $216,169 over the 5 years (2013 to 2017) .
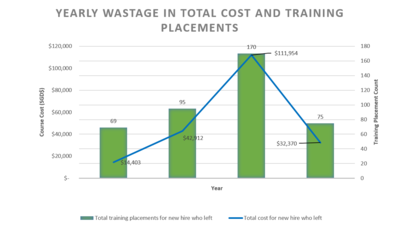
Total cost wastage in training new hires who left YY saw an increase from 2013 ($14,529) to 2016 ($111,954) , expanding cost by 670.5% over 4 years. Though 2017 incurred less cost from 2016 ($32,370), it was still a 122% increase from 2013. On the other hand, total training placements peaked in 2013 (171) and 2016 (170) with the lowest wastage recorded in 2014 (69).There was no obvious trend identified in yearly training placements for new hires. Nonetheless, total training placements dropped by 56% in 2017 as compared to 2013.
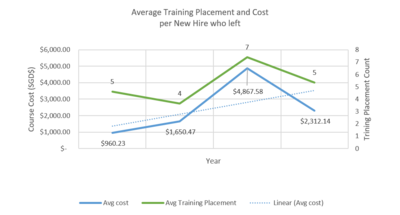
Overall, average cost wastage incurred to train new hires who eventually left showed an increasing linear trend over the 5 years, tripling from $538 in 2013 to $2312 in 2017. On average, new hires who left had 5 to 7 training placements each within the year that they were in the company. Common course type identified included HSEQ training (e.g. safety orientation) and Miscellaneous training (e.g. HR orientation).
XX Business Unit
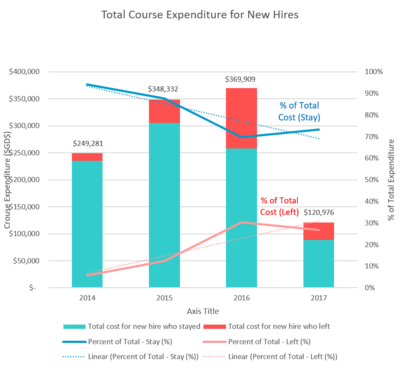
Total course expenditure to train all new hires in XX showed an increasing trend, with the exception of a significant decrease cited in 2015 ($77,595). Overall, a total amount of $500,730 was incurred to new hires who eventually left XX from 2013 - 2017. As of 2017 , course expenditure increased by 55% since 2013 although it was 30% decline from 2016 which recorded the highest expenditure of $223,928 among the 5 years.
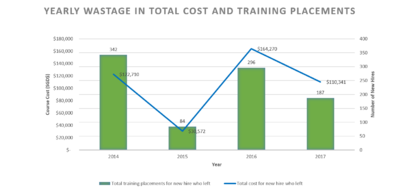
Course expenditure for new hires who left XX accounted for 35% to 51% across the 5 years. Course expenditure for new hires who left XX showed similar trends with the highest course expenditure wastage incurred in 2016 ($164,270). Based on the last observation in 2017, course expenditure for this group increased by 51% since 2013.
Total training placements wasted on new hires who left from XX peaked in 2014 at 342 placement before dropping significantly the next year to 84 placements, the lowest wastage in placements experienced among 5 years. Overall, total training placements for new hires who left XX dropped by 18% in 2017 as compared to 2013.
A comparison of average cost in training per employee for new hires who left showed an increasing trend. Average cost incurred in training per employee rose by 65% in 2017 ($3,245) since 2013 ($1,968). However ,this was in contrast to an overall decrease in average training placements observed from 2013 (6 placements) to 2017 (5 placements).
This observation could likely be resulted from the longer training hours employees underwent per training placement. Similar to employees in YY Business Unit , new hires mostly undergone HSEQ training (e.g. Safety orientation) and Misc (e.g. HR Orientation).


