Difference between revisions of "ANLY482 AY2017-18T2 Group32: Project Overview/Data"
Jump to navigation
Jump to search
Zycheng.2014 (talk | contribs) |
Zycheng.2014 (talk | contribs) |
||
| Line 80: | Line 80: | ||
|86 | |86 | ||
|- | |- | ||
| + | |||
| + | ==== Initial Exploratory Data Analysis ==== | ||
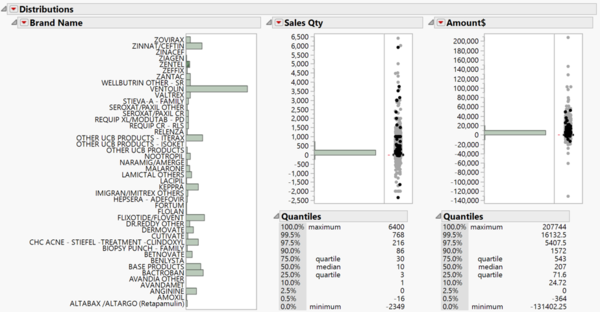
| + | For Invoice, filter with the TCE brands. Here is a distribution of all the TCE brands and its sales performance. | ||
| + | |||
| + | [[File:Data 1.png | 600px | center]] | ||
|} | |} | ||
Revision as of 23:09, 25 February 2018
Return to ANLY482 AY2017-18 Home Page
| Description | Data | Methodology |
Metadata
With a clear understanding of what our sponsor had in mind, our team began data munging process. This includes: data cleaning, transformation, and integration to obtain a an integrated data table via JMP for further analysis.
For our project, the sponsor has provided us with five datasets - Invoice data, TCE Account List data, TCE Brands data, HCO and HCP data that stretched from the year 2015 to today.
Initial Exploratory Data Analysis
For Invoice, filter with the TCE brands. Here is a distribution of all the TCE brands and its sales performance.
| File/ Sheet Name | Description | Count |
|---|---|---|
| HCP | Information on individual doctors | 7553 |
| HCO | Information on clinics, organizations | 4919 |
| Invoice Detail | Transactions of product purchases by Target Audience | 337518 |
| TCE Account List/ TCE Brands only GP_SP | Annual sales for TCE brands over all accounts | 2361 |
| TCE Brands | Brands amongst the entire list of drugs that falls under the TCE category | 86 |

