Difference between revisions of "ANLY482 AY2016-17 T2 Group7: Exploratory Data Analysis"
Yx.lim.2013 (talk | contribs) (edited content) |
Yx.lim.2013 (talk | contribs) m |
||
| Line 95: | Line 95: | ||
''Figure 12: Search Count of 'Others'''<br/> | ''Figure 12: Search Count of 'Others'''<br/> | ||
| − | <u>Analysis: Awareness of the number of searches throughout the year </u> <br/> | + | <u>Analysis 1: Awareness of the number of searches throughout the year </u> <br/> |
There is great variation in the number of searches across the span of a year, and these searches on the EZproxy are contributed by students - Undergraduate, Masters, PhD and others (international exchange, local exchange, visiting students). As the users of the EZproxy site are students of Singapore Management University, the spike in the number of searches can be seen during the months of the regular Terms (Term 1 and 2) - January to March and Mid-August to November respectively. | There is great variation in the number of searches across the span of a year, and these searches on the EZproxy are contributed by students - Undergraduate, Masters, PhD and others (international exchange, local exchange, visiting students). As the users of the EZproxy site are students of Singapore Management University, the spike in the number of searches can be seen during the months of the regular Terms (Term 1 and 2) - January to March and Mid-August to November respectively. | ||
Latest revision as of 18:36, 20 April 2017
After processing the data, we tested it against 2 test cases, namely the data analysis of the search counts and text analytics of 2 databases, Euromonitor and Lawnet. The first test case is as follows: Tools: Tableau 10.1, SAS Enterprise Guide 7.1 (64-bit)
For the 12 months’ worth of data (2016_processed_log.csv)
| Parameters | Description | Example |
|---|---|---|
| libuser_ID | Student ID hashed by the SMU Library so as to protect the identity of users | 65ff93f70ca7ceaabcca62de3882ed1633bcd14ecdebbe95f9bd826bd68609ba |
| libsession_ID | Each session is identified by a unique ID, which corresponds to 1 session by a single user | tDU1zb0CaV2B8qZ |
| search_database | The e-resources database which the search query is searched on | heinonline |
| timestamp | Date and time when the search query is executed by the user in the format: DD/MMM/YYYY HH:MM:SS | 01/Jan/2016:00:01:36 |
| search_query | Search query that was being searched by the user | (The%20Great%20Peace) |
Student Information Data (Student User List)
| Original Parameters | New Parameters | Description | Example |
|---|---|---|---|
| libuser_ID | Student ID hashed by the SMU Library so as to protect the identity of users | 65ff93f70ca7ceaabcca62de3882ed1633bcd14ecdebbe95f9bd826bd68609ba | |
| Statistical Category 1 | school | This indicates the school that the user is from | School of Law |
| Statistical Category 2 | programme_type | This indicates the specific programme the user is undertaking | Bachelor of Laws |
| Statistical Category 3 | admission_year | This indicates the year which the user is admitted into SMU | AY_2013 |
| Statistical Category 4 | graduating_year | This indicates the year which the user is graduated from SMU | GY_2017 |
| User Group | education_level | This indicates which level of education the user is in, typically Masters or Bachelors programme | UNDERGRADUATE STUDENTS |
With the assumption of each unique session ID and user ID along with each database being one search query, we group the data set based on these 3 variables. The search count is extracted from the log data and proves to be valuable in understanding the search querying behaviors of SMU students throughout the year of 2016. Trends and peaks are observed when the number of searches are broken down by months.

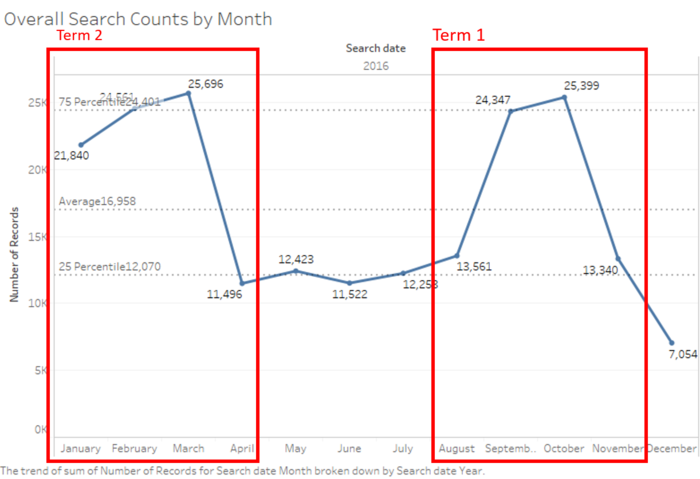
Figure 8: Overall Search Counts by Month

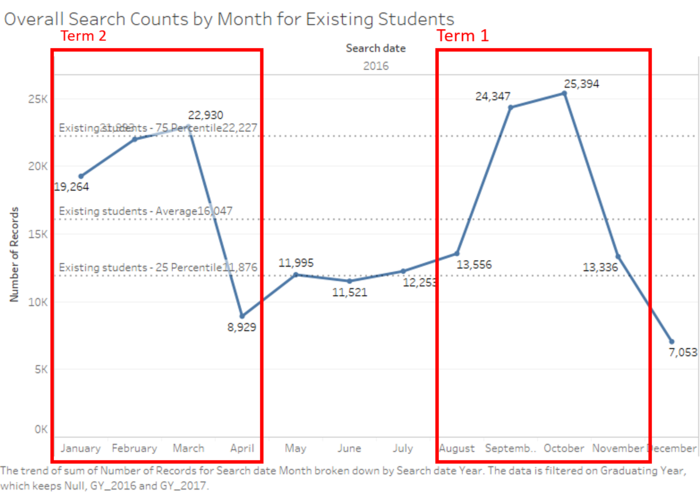
Figure 9: Overall Search by Month for Existing Students

Figure 10: Search Count by Existing Students during Academic Weeks

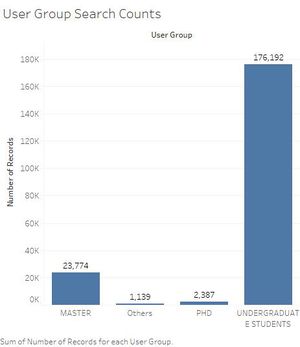
Figure 11: User Group Search Counts

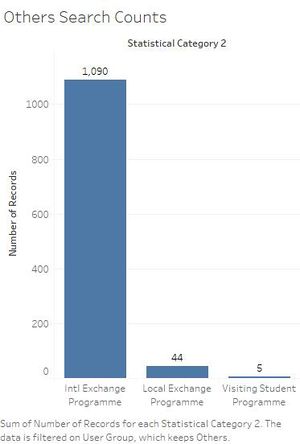
Figure 12: Search Count of 'Others'
Analysis 1: Awareness of the number of searches throughout the year
There is great variation in the number of searches across the span of a year, and these searches on the EZproxy are contributed by students - Undergraduate, Masters, PhD and others (international exchange, local exchange, visiting students). As the users of the EZproxy site are students of Singapore Management University, the spike in the number of searches can be seen during the months of the regular Terms (Term 1 and 2) - January to March and Mid-August to November respectively.
In Figure 8, we could potentially identify the start and end of the 2 regular Terms just by observing where the number of searches experience a gradual dip. The overall trend of the number of searches forms the shape of a jagged mountain for both Terms, thus the start and ends of the mountains fall around the start and ends of the Terms. From Figure 9, we decided to generate another figure showing how students search throughout the weeks in academic terms. We observed that the peaks in the regular terms, Terms 2 and 1, occur during Week 8, which is the recess week. This could be because that majority of the students start their research during recess week.
Next, we observed that there is a decrease in the number of searches in the weeks following the recess week (Week 8) and then we noticed there is an unusual increase in the number of searches again in Week 14, which is the study week. This same trend can be seen on both Term 2 & 1. We believe that this increase in the number of searches could be due to the students performing searches as they revise for their final examinations.
Discussion of Analysis 1:
We want to understand the number of searches throughout the year and see if there are any observable trends. Thus, we initiated the breakdown of the number of searches by months, to have a better look at where the peak periods are.
The sponsors will be able to use these results to know the amount of load their server must be ready to handle at different periods of the year, especially during the undergraduate semesters. Furthermore, such results would be very useful for the sponsors in deciding at which period of the year they should organize library training to train the users in effective academic search querying which is vastly different to the generic search querying methods they typically perform on search engines such as Google.

Figure 13: Dip in Weekends, Term 2

Figure 14: Dip in Weekends, Term 1

Chart 6: Search Count by Days for Term 2: Jan-March 2016

Chart 7: Search Count by Days for Term 1: Aug-Nov 2016

Chart 8: Chinese New Year in 2016
Analysis 2: Understanding the students’ behaviors in searches during the Terms
From the Figure 12 & 13, we noticed that there is a dip in the number of searches performed every weekend (Saturdays & Sundays). For example, there is a plunge in the number of searches on 16th of January (Saturday). Thus, this may show that the perception of SMU students studying all day every day and even the weekends may be untrue. Or it could be that SMU students generally do not perform as many searches for their research on weekends.
However, upon further contrasting of the trends in Figure 14 and 15 side-by-side, we discovered that there is always a spike in the number of searches on the first day of Recess week in both Terms. For Term 2, Recess week starts on 22 Feb where there is a visible spike from 21 Feb to 22 Feb. And for Term 1, Recess week starts on 3 Oct where there is also a visible spike from 2 Oct to 3 Oct (this spike happens to be the highest in the entire Term 1). And in both cases, the number of searches decreases gradually until the end of the Recess Week (28 Feb for Term 2 and 9 Oct for Term 1 respectively). This is a very interesting discovery as it potentially shows that students typically start their research on the first day of Recess week, thereby contributing to the spike in number of searches, and then as the Recess week ends, the amount of research students performed becomes lesser too.
From Figure 16, we observed the highest spike in Term 2, which takes place on 11 Feb 2016. We could not find a possible explanation for this other than it being the end of the Chinese New Year holidays (9 & 10 Feb 2016) and students may be picking up on their research, thus explaining the spike in number of searches performed on 11 Feb 2016.
Discussion of Analysis 2:
In SMU, 1 of the common perception is that SMU students study all day every day, even the weekends. Thus, we want to see if this perception of SMU students is indeed true. Next, we want to see if there is a surge in searches when the Term reaches the week where group projects are released. This is because projects in SMU largely requires the students to perform desk research and 1 of the many places to do so is through the SMU library’s EZproxy e-resources database.
The sponsors requested for a weekly and daily analysis to be done so that they would be able to observe and understand the fluctuation in search counts during semesters in the year. This is crucial as historically they understand that students typically start their research near project submission weeks, typically after midterm examinations and nearing the end of semester. These figures can prove numerically and definitively that it is indeed true to some extent. The sponsors can then allocate research librarians during these periods to aid students along in their research.