Difference between revisions of "Group14 Project Findings"
Gaurib.2013 (talk | contribs) |
Gaurib.2013 (talk | contribs) |
||
| Line 50: | Line 50: | ||
{| style="background-color:#ffffff; font-family:DIN Alternate; margin: 3px auto 0 auto" width="70%" | {| style="background-color:#ffffff; font-family:DIN Alternate; margin: 3px auto 0 auto" width="70%" | ||
|- | |- | ||
| − | ! style="font-size:15px; text-align: center; border-top:solid #ffffff; border-bottom:solid #2e2e2e" width="150px" | [[ | + | ! style="font-size:15px; text-align: center; border-top:solid #ffffff; border-bottom:solid #2e2e2e" width="150px" | [[Group14_Project_Findings| <span style="color:#3d3d3d">Data</span>]] |
! style="font-size:15px; text-align: center; border-top:solid #ffffff; border-bottom:solid #ffffff" width="20px"| | ! style="font-size:15px; text-align: center; border-top:solid #ffffff; border-bottom:solid #ffffff" width="20px"| | ||
Revision as of 21:20, 17 March 2017
| Data | Methodology |
|---|
Data
Currently we have received the raw data provided by our sponsor including the following files:
- Collection_Dataset_FY13 and FY14.xlsx
- Patron_Headers.csv
- Patron_Dataset_FY13.csv & Patron_Dataset_FY14.csv
- TXN_Headers.csv
- TXN_FY13.csv & TXN_FY14.csv
Summary of Data Cleaning
1.Both the TXN_Y13 & TXN_Y14 datasets displayed that the transaction’s timeline from each year’s April to the next year’s April. (12 months)
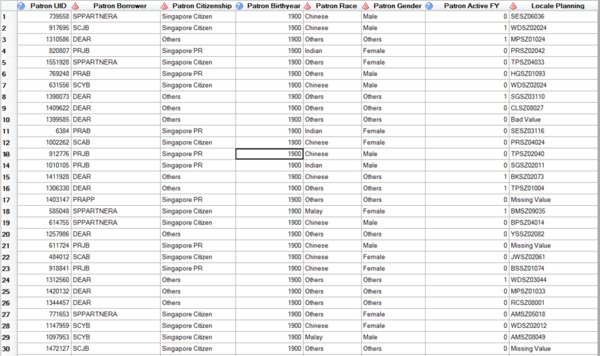
2.In both the TXN_Y13 & TXN_Y14 datasets, there were rows where the Patron UID was set to “0”, whereas both the Patron_Dataset_FY13 & Patron_Dataset_FY14 datasets do not contain any data of a Patron with UID “0”. After exploring the data, 1335 counts & 65 counts of rows of Data contained Patron UID set to “0” in the TXN_Y13 & TXN_Y14 datasets respectively.
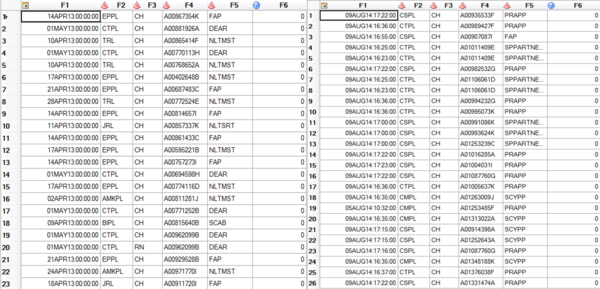
3.In the TXN_Y13 dataset, there were Patron Borrower Category Code types such as “DEAR”, “DEARC”, “DEARS” & “Deceased”. Based on the previous team’s data cleaning we discovered that “DEAR” should be removed from the dataset completely as it refers to institutional partnership programmes and NLB suggested to remove all records with Patron Borrower Category Code set to “DEAR” from further analysis. However, there was no mention of the other codes “DEARC”, “DEARS” & “Deceased”, thus for the time being our team has decided to remove those records as well. The frequency of these codes are displayed below for TXN_Y13 & TXN_Y14 datasets respectively.
4.In the TXN_Y13 Transaction Dataset, 3 records have Branch Code set to “Bad Value” and 3,065 records set to “Missing Value”. In the TXN_Y14 Transaction Dataset, 9,467 records have Branch Code set to “Bad Value” and 1,600 records set to “Missing Value”.
5.Based on the updated Collection dataset, it was confirmed that there are currently 26 active libraries for NLB and therefore transactions in both the TXN_Y13 & TXN_Y14 datasets which did not belong to these 26 branch codes were removed, such as
- a. 07LKCRL
- b. 08LKCRL
- c. 11LKCRL
- d. ORN
- e. RN
- f. RU
6.Removed any transactions in both the TXN_Y13 & TXN_Y14 datasets that stated that the birthyear of the Patrons is “1900”, “2015”,”2016” as that referred to values being set to the year that the institutional programme was set up.
Additional Data
1.Surrounding Facility Dataset:
- Geographical location of Shopping Malls/ Plazas
As indicated in the senior’s group’s report, there is “positive inter-store externalities generated by the shopping malls that operate near the library (Brueckner, 2011), as more consumers visit the shopping malls, the patronage level of the nearby library will likely follow a similar increase.” Therefore, our team will keep studying the significant effect on the patronage of the libraries from the distribution of various shopping malls.
- Geographical location of Primary Schools/ Secondary Schools/ Junior Colleges
As one of the largest groups visiting libraries, students are nonnegligible given that they are likely to spend time in the libraries after school hours and during examination period. Hence, our team will also have a deep look at the impact on the patronage of the libraries based on the location distribution of nearby educational institutions (primary schools, secondary school, junior colleges) using the data derived online.
2.Transportation Accessibility Dataset:
- Geographical location of MRT Stations (A greater weight will be assigned to MRT interchanges in the analyses)
- Geographical location of Bus Stops & No. of Bus Services Provided
In order to evaluate the likelihood for a patron to visit a library, the accessibility of transportation also plays an important role. With an easily accessed public transport network connected to a library, there will be less hindrance and thus a higher probability for a patron to visit the library. To analyze more deeply, the impact of public transportation may also vary between different neighborhoods where people are of different social and financial levels. Therefore, our team will embrace the available transportation dataset (MRT and bus stops) in our model with weight assigned to better measure and predict the attractiveness of the libraries.
3.Geographical Dataset:
- Building within costaloutline.shp
As mentioned above, although the subzone clustering analysis conducted by the senior’s team returned a relatively executable model, our team aims to build up on the next level and present a more precise and accurate analysis. In terms of the geographical dataset, subzones no longer meet our demand due to the wide coverage of each subzone and the inequality analysis on patrons from different parts within the same subzone. Therefore, our team will utilize the geospatial data at HDB level (after transformation) and link it to the post-geocoding patron’s data so as to better analyze the patronage of each library.


