Difference between revisions of "ANLY482 AY2016-17 T2 Group19 Methodology"
| Line 7: | Line 7: | ||
<!--Navigation--> | <!--Navigation--> | ||
<center> | <center> | ||
| − | {| style="border-collapse: separate; border-spacing: 0; font-size:13px; font-family: Trajan Pro; border-width: | + | {| style="border-collapse: separate; border-spacing: 0; font-size:13px; font-family: Trajan Pro; border-width: 0px; border-radius: 0px; border-style: solid; border-color: #ffffff; padding: 0; height: 0px;" width="100%" |
|- | |- | ||
| Line 14: | Line 14: | ||
[[ANLY482_AY2016-17_T2_Group19|<font color="#000000"><b>OVERVIEW</b></font>]] | [[ANLY482_AY2016-17_T2_Group19|<font color="#000000"><b>OVERVIEW</b></font>]] | ||
| − | ! style="border-style: none; border-width: 0 1px 1px 0; border-left: | + | ! style="border-style: none; border-width: 0 1px 1px 0; border-left:0px solid #a4a4a6; background-color:#ffffff"| |
[[File:Protege_data.svg|40px|link= ANLY482_AY2016-17_T2_Group19_Data ]] | [[File:Protege_data.svg|40px|link= ANLY482_AY2016-17_T2_Group19_Data ]] | ||
[[ANLY482_AY2016-17_T2_Group19_Data| <font color="#000000"><b>DATA</b></font>]] | [[ANLY482_AY2016-17_T2_Group19_Data| <font color="#000000"><b>DATA</b></font>]] | ||
| − | ! style="border-style: none; border-width: 0 1px 1px 0; border-left: | + | ! style="border-style: none; border-width: 0 1px 1px 0; border-left:0px solid #a4a4a6; background-color:#ffffff"| |
[[File:Protege_Methods.svg|40px|link= ANLY482_AY2016-17_T2_Group19_Methodology ]] | [[File:Protege_Methods.svg|40px|link= ANLY482_AY2016-17_T2_Group19_Methodology ]] | ||
| − | [[ANLY482_AY2016-17_T2_Group19_Methodology|<font color="#a1212e"><b>METHODOLOGY</b></font>]] | + | [[ANLY482_AY2016-17_T2_Group19_Methodology|<font color="#a1212e"><b>METHODOLOGY & ANALYSIS</b></font>]] |
| − | + | ! style="border-style: none; border-width: 0 1px 1px 0; border-left:0px solid #a4a4a6; background-color:#ffffff"| | |
| − | |||
| − | |||
| − | |||
| − | ! style="border-style: none; border-width: 0 1px 1px 0; border-left: | ||
[[File:Protegemaster-03.svg|40px|link= ANLY482_AY2016-17_T2_Group19_Findings ]] | [[File:Protegemaster-03.svg|40px|link= ANLY482_AY2016-17_T2_Group19_Findings ]] | ||
[[ANLY482_AY2016-17_T2_Group19_Findings| <font color="#000000"><b>FINDINGS</b></font>]] | [[ANLY482_AY2016-17_T2_Group19_Findings| <font color="#000000"><b>FINDINGS</b></font>]] | ||
| − | ! style="border-style: none; border-width: 0 1px 1px 0; border-left: | + | ! style="border-style: none; border-width: 0 1px 1px 0; border-left:0px solid #a4a4a6; background-color:#ffffff"| |
[[File:Protege_poster.svg|40px|link= ANLY482_AY2016-17_T2_Group19_Poster ]] | [[File:Protege_poster.svg|40px|link= ANLY482_AY2016-17_T2_Group19_Poster ]] | ||
| − | [[ANLY482_AY2016- | + | [[ANLY482_AY2016-17_T2_Group19_Documentation| <font color="#000000"><b>DOCUMENTATION</b></font>]] |
| + | ! style="border-style: none; border-width: 0 1px 1px 0; border-left:0px solid #a4a4a6; background-color:#ffffff"| | ||
| + | | ||
| + | [[ANLY482_AY2016-17_Term_2| <font color="#000000"><b>BACK TO COURSE</b></font>]] | ||
|} | |} | ||
</center> | </center> | ||
Revision as of 15:13, 27 February 2017
Methodology
Phase 1: Evaluation of past data, data cleaning, qualitative research in key pharmaceutical events over the past 3 years
Data would first be processed and current and past performances would be evaluated based on sales performances over the past 3 years from various perspectives. This would be carried out through a combination of time series analysis of purchase baskets of at the granular individual customer level as well at the more aggregate customer segment level with special focus on the less researched segments of non-chain pharmacies, general practices, and specialists. In this phase, an open-ended approach will be taken and hence, data exploration goals are not limited to the above mentioned.
Phase 2: Identification of key environmental variables, stress events, and trends
Through this evaluation, key environmental variables that influence sales as well as responses to stress events (shock events such as crises) would be identified. Sales could then be further be segmented into expected sales and unexpected sales and separately analysed. This is inspired by the application of capital adequacy concepts in the form of expected losses and unexpected losses and would translate into expected sales that deviates from the mean sales level, and unexpected sales. This would allow the company to make more informed decisions about sales projections.
In addition, this analysis also aims to identify areas of potential optimisation in the form of human resource management (setting sales targets and turnover mitigation strategies) to explore areas where there have been significant trends in market basket change so as to identify potential opportunities in product placement.
Phase 3: Dashboard development
Given the narrowed focus, the next phase of the project would be to develop a visual analytics dashboard using R. This is done with continuity in mind as this project will also serve as pilot efforts into analytics for company Z.
Overall Thought-Process
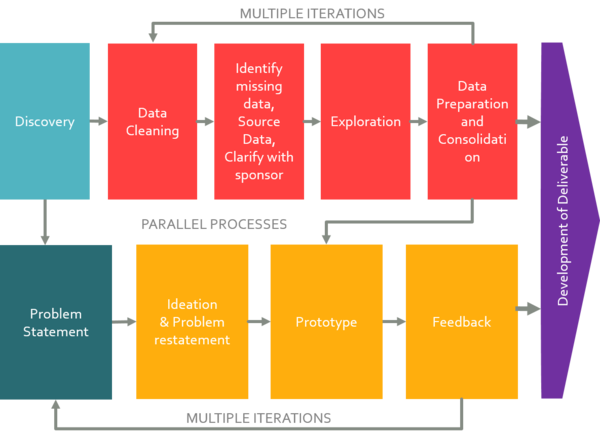
The following is a planned process flow of actions to be taken starting from the collection of the raw data:

