Preliminary analysis
Email Data
Before Cleaning
Our data consists of 14 columns as described below:
Column Explanations
| Date
|
Timestamp of the email
|
| Remote IP
|
If the email exchange is external then this column shows the external person's email
|
| Remote
|
The TrustSphere employee who is receiving or sending the email
|
| Remote Domain
|
Always TrustSphere
|
| Local
|
Email address of the person sending the email
|
| Local Domain
|
Domain of the person who is sending the email
|
| Originator
|
Inbound, outbound or internal (if you’re receiving the email, sending it or if the email is between 2 TrustSphere employees)
|
| Direction
|
Always TrustSphere in this case
|
| Domain Group
|
Email Header (Subject Line)
|
| Subject
|
Type of message: email/im (instant messaging)/voice/sms
|
| Inbound Count
|
Number of emails received
|
| Outbound Count
|
Number of emails sent
|
| Size
|
Size of the message (number of characters)
|
| Msgid
|
Encoded Message ID
|
Data Statistics
| Number of rows
|
121,154
|
| Date Range
|
11/26/2016 8:00 am to 02/01/2017 00:00 am
|
After Cleaning
For our analysis, we only need emails sent internally, that is, from one employee in the company to another. Our data also contained instant messaging information which we will also not be using for our analysis. Thus we filtered out
- Originator: Inbound and Outbound (which is either to or from external email addresses)
- Subject: im (instant messaging)
Additionally, we also found several system email addresses that can potentially skew the data (due to mass emails). Hence, we decided to eliminate emails to and from these email addresses as well. Below, we have listed some of the email addresses and the number of times they occurred in the data set.
| analytics@trustsphere.com (134)
|
heartbeat@trustsphere.com (1658)
|
| jira@trustsphere.com (1386)
|
sfdc@trustsphere.com (899)
|
| trustsphere.office@trustsphere.com (15)
|
tv.reports@trustsphere.com (1394)
|
| marketing.team@trustsphere.com (322)
|
trustvault.selfservice@trustsphere.com (95)
|
Number of rows after removing:
| im + inbound/outbound
|
45,855
|
| system email addresses
|
29,797
|
Further, we removed columns that we do not need in our analysis. These include:
- Remote IP: We don't need this because we are only using internal email exchange communication
- Remote Domain: Since we only have internal data, this will always be TrustSphere's domain. Hence keeping it will be redundant.
- Local Domain: Since we only have internal data, this will always be TrustSphere's domain. Hence keeping it will be redundant.
- Direction: This will always be within TrustSphere
- Inbound Count: At this stage, we are focusing on relationship analysis (between two employees) rather than individual analysis within a network. We may need this column in the second half of our project.
- Outbound Count: At this stage, we are focusing on relationship analysis (between two employees) rather than individual analysis within a network. We may need this column in the second half of our project.
- Subject: We are only using email data, and hence this will always have a value of 'em'. Hence keeping it will be redundant.
Email Data
| Name
|
Name of employee
|
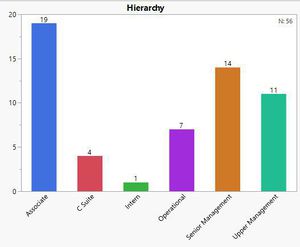
| Hierarchy
|
Designation of employee
|
| Department
|
Department of employee
|
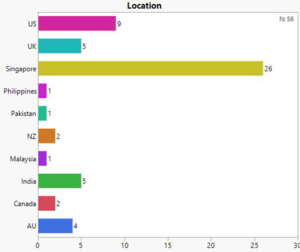
| Location
|
Location where the employee is based
|
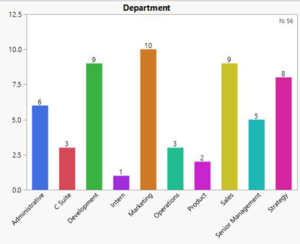
- Department: Marketing, Development and Sales have the most number of employees
- Hierarchy: Associates are the highest in number
- Location: Singapore being the head quarters has the most number of employees
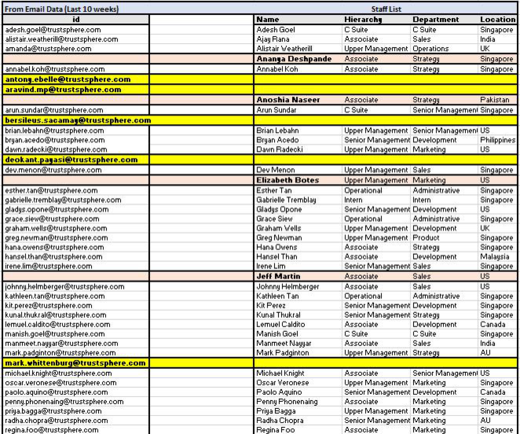
Highlighted in Pink: Employee is present in staff list but do not have any email interaction in the past 10 weeks. There are 8 such employees.
Highlighted in Yellow: Employee is present in the email interaction data for the past 10 weeks, but not present in the staff list. There are 5 such employees.
Network Exploration
Node: Each employee
Node Color: Hierarchy
Node Size: Eigenvector Centrality
Conclusions
No weights for edges – purely based on quantity
Many Senior Management and Upper Management Employees seem to have a low centrality score
Possibly a biased solution
Need for feature engineering to add weight that removes the bias

Survey Questions
|


