Difference between revisions of "ANLY482 AY2016-17 T2 Group21 : PROJECT FINDINGS"
| Line 130: | Line 130: | ||
<hr> | <hr> | ||
| − | + | [[File:ugrowth.png|500px]] | |
[[File:userreg.png|500px]] | [[File:userreg.png|500px]] | ||
| Line 160: | Line 160: | ||
<hr> | <hr> | ||
| − | + | [[File:urevenue.png|500px]] | |
[[File:revenue.png|700px]] | [[File:revenue.png|700px]] | ||
| Line 172: | Line 172: | ||
<hr> | <hr> | ||
| − | + | [[File:uorders.png|500px]] | |
[[File:orders.png|470px]] | [[File:orders.png|470px]] | ||
| Line 197: | Line 197: | ||
<hr> | <hr> | ||
| − | + | [[File:uproducts.png|500px]] | |
[[File:products.png|370px]] | [[File:products.png|370px]] | ||
Revision as of 15:45, 23 February 2017
| Mid-Term |
|---|
Executive Summary
Users
- One third of the registered users do not make purchases
- Top 25% of most valuable customers gives 72.52% of revenue
- On average, customers in the top segment orders 12 times more than bottom tier customers
- Large growth in offline buyers
- Due to offline referrals
- Huge spikes of customers on Sunday and Thursday which corresponds to their weekly collection launches
- Customer influx during lunch hours and after dinner
- Influx during lunch is prominent during days of collection launch
Revenue
- Sales reflect a season pattern which peaks in May
- 2016 did not follow this pattern, instead reflecting a peak in January
Orders
- Decrease in the average product pricing leads to an increase in customer order size and an overall increase sales revenue generated per order
- Hypothesis: Dressabelle's customer base is price sensitive
Order Source
- Organic and referrals are the order mediums for at least 54% of the new customers
- Email is the most effective medium for generating subsequent orders
Products
- Dressabelle’s product mix offering mainly comprises of Dresses which make up 63% of the total products offered
- Tops are a far second
Products by Categories and Color
- Free sizing is significantly more prominent in Tops and Outerwear than compared to other categories
- Products of size S and size M are generally purchased more often than products of size L
- Basic colors, such as Blue, White, Navy, Blue, and Grey, prove to be the most popular
- Black is by far the most popular color
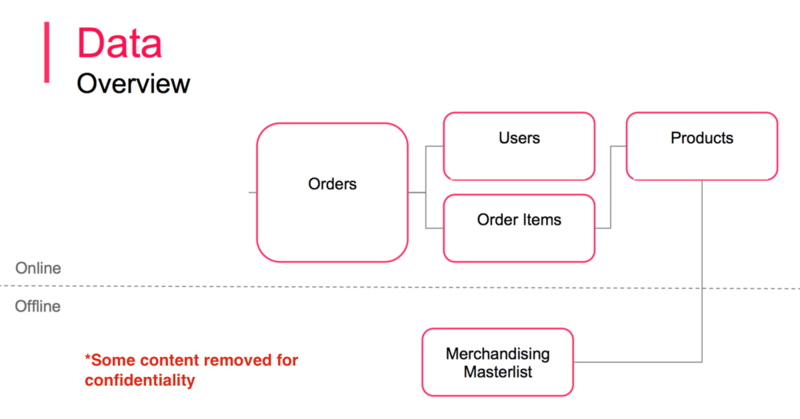
Data
Exploratory Data Analysis
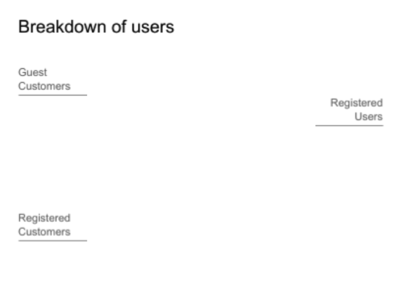
Our team brokedown Dressabelle's user base in three categories:
- Guest Customers (those that purchase without an account)
- Registered Customers (those that purchase with a registered account)
- Registered Users (those that have an account but has never purchased anything)
Findings: ⅓ of total users do not make purchases
Our team weighted customers according to their contribution towards Dressabelle's revenue.
Findings:
1. Top 25% of most valuable customers gives 72.52% of revenue
2. Top customers on average orders 12 times more than bottom tier customer
Findings:
1. Huge growth in 2013-14
2. Large growth of non-buyers in 2016, possibility due to offline referral
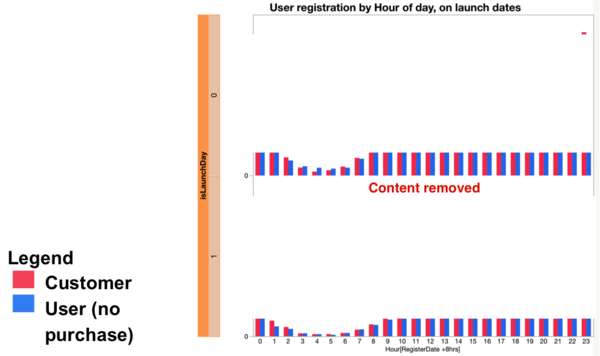
Huge spikes of customers on Sunday and Thursday, which corresponds to weekly collection launches
Findings: 1. Customers influx during lunch hours and after dinner
2. Influx of customers during lunch is prominent during collection launch days
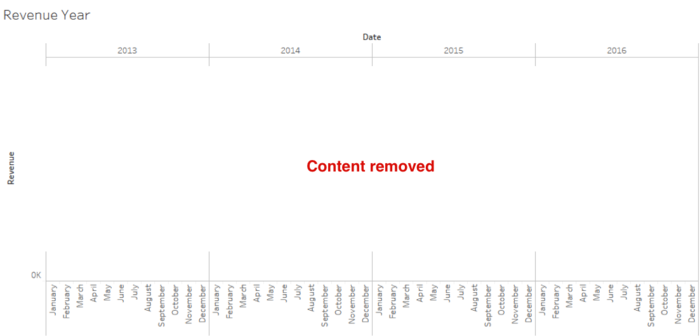
1. Sales tends to peak in May
2. Sales pattern in 2016 did not follow the usual sales trend
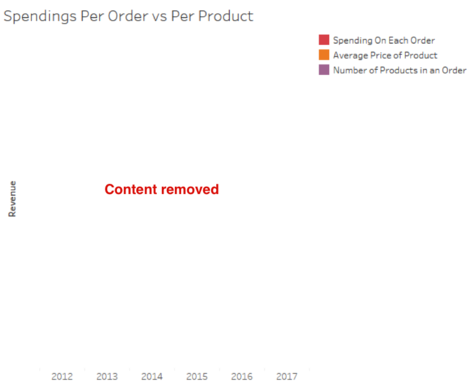
1. Decrease in the average pricing of a product results in the increase in order size and overall revenue earned
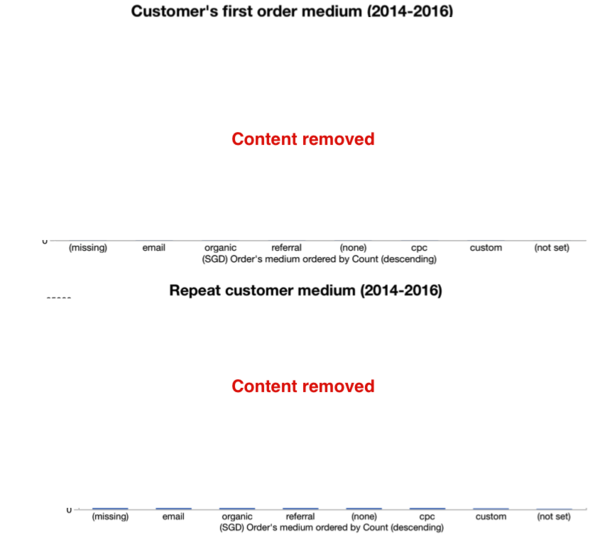
1. Organic and referrals comprise of at least 54% of new customers
2. Email remains effective in generating repeated sales
1. Accuracy of tracking
2. Tracking starts mid 2013
1. Dressabelle’s main offering is in the dress category of 63%
2. Tops are a far second
1. For tops and outerwear, free sizing is significantly more prominent than the other categories
2. In general, sizes S & M are generally more popular than L
Categories are not accurately defined as of now
1. Basic colors (Blue, White, Navy, Blue & Grey) prove the most popular
2. Black is by far the most popular colour
Merchandising Analysis
Proposed metrics for Merchandising
1. Sell Through Rate
Quantity of products sold ( in 2 days ) / Quantity of products in inventory
This gives us the stock efficiency
2. Sales Velocity
Quantity of products sold / Time window( 2 days window )
This gives us the product popularity
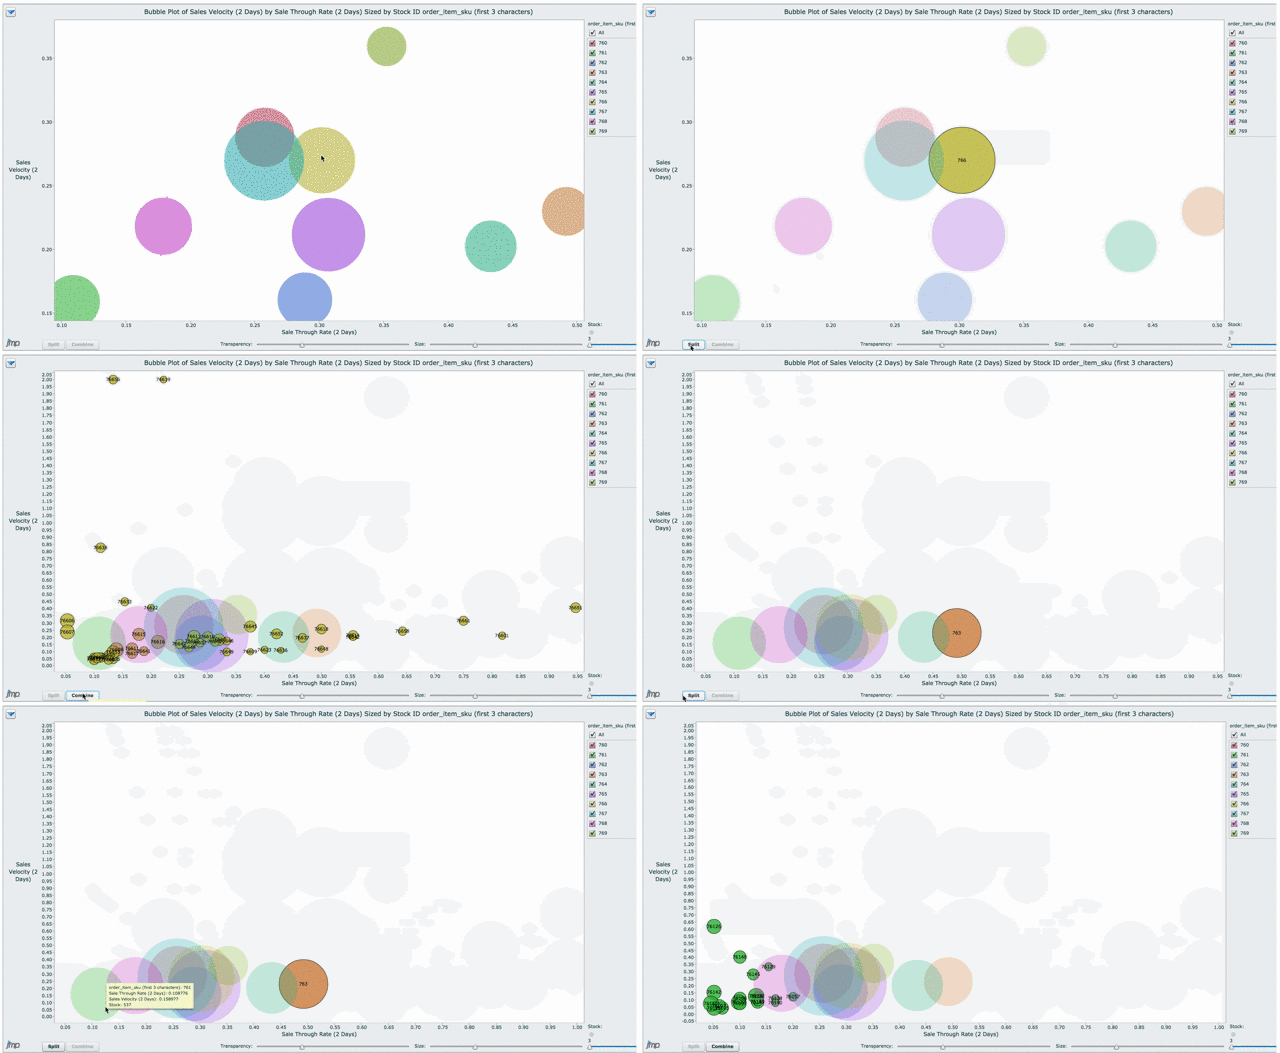
Usually, Sell through rate is calculated in a time window of 1 week or 1 month, which coincides with the sales cycle of the company. However, since Dressabelle releases 2 collections per week, we consider their sales cycle to be 48 hours.
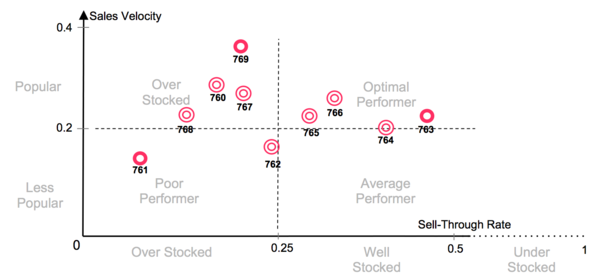
Below is a chart of collections 760 - 769 in terms of sales velocity versus sell through rate. Each collection falls into one of four quadrants, each of which has different implications and causations.
Our group then plotted the collections on a bubble plot, with splitting into each SKU in each category.
We are able to measure the performance of each individual product (SKU). Dressabelle can use this to gauge the popularity and demand of their future collections.
For example, collection 761 falls into the bottom left quadrant of our graph, and as a result, we can classify it as a "poor performer". Further examination of our data shows that collection 761 coincided with Lunar New Year sales, as Dressabelle purchased a much higher quantity of each product than they usually would. Since the demand was not up to expectations, this resulted in a low score in both metrics.
On the flip side, collection 763 falls into the bottom right quadrant of our graph. We can classify it as an above average performer. On further inspection of transactional data of the collection, we can see that majority of the SKUs sold well within the first two days of launch.
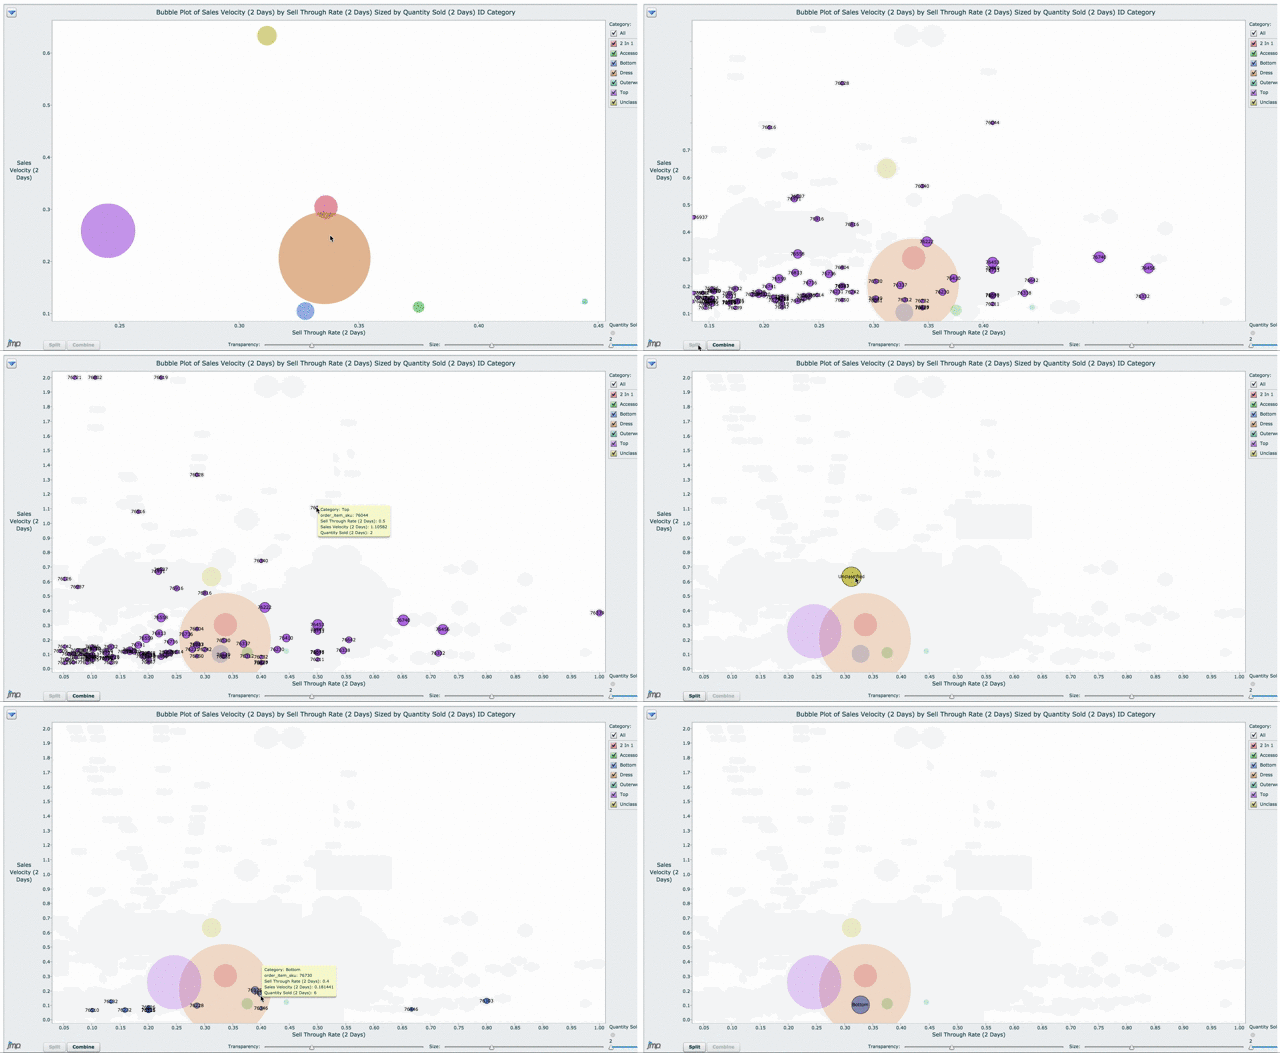
Our team also plotted a similar bubble plot broken down by product category
