Difference between revisions of "APA Project Overview"
Jump to navigation
Jump to search
Aayushg.2013 (talk | contribs) m |
Aayushg.2013 (talk | contribs) m |
||
| Line 27: | Line 27: | ||
|style="vertical-align:top;width:30%;" | <div style="background: #10d0e5; padding: 13px; font-weight: bold; text-align:center; line-height: wrap_content; text-indent: 20px;font-size:20px; font-family:helvetica"> <font color= #ffffff>Motivation</font></div><br/> | |style="vertical-align:top;width:30%;" | <div style="background: #10d0e5; padding: 13px; font-weight: bold; text-align:center; line-height: wrap_content; text-indent: 20px;font-size:20px; font-family:helvetica"> <font color= #ffffff>Motivation</font></div><br/> | ||
<p> | <p> | ||
| − | The way the employees of a company collaborate within teams and even across regions is very important to the success of a company. Thus, the business leaders are interested in keeping a check on this area of the firm and ask various questions such as:<br> | + | The way the employees of a company collaborate within teams and even across regions is very important to the success of a company. Thus, the business leaders are interested in keeping a check on this area of the firm and ask various questions such as:<br><br> |
• Are different geographies working well?<br> | • Are different geographies working well?<br> | ||
• Which employees work in silos?<br> | • Which employees work in silos?<br> | ||
| − | • How effective are the sales people at email correspondence?<br> | + | • How effective are the sales people at email correspondence?<br><br> |
Answers for such questions usually rely more on qualitative observations as not many standard metrics can be directly used to track these details. Due to its general derivation, the results are often considered unreliable and hence non-actionable. The main motivation of our project is to assist TrustSphere to derive reliable and actionable insights regarding collaboration due to our data-driven approach. | Answers for such questions usually rely more on qualitative observations as not many standard metrics can be directly used to track these details. Due to its general derivation, the results are often considered unreliable and hence non-actionable. The main motivation of our project is to assist TrustSphere to derive reliable and actionable insights regarding collaboration due to our data-driven approach. | ||
</p> | </p> | ||
| Line 64: | Line 64: | ||
  7. <b>Msg ID</b>: unique ID given to every emailing chain <br> |   7. <b>Msg ID</b>: unique ID given to every emailing chain <br> | ||
  8. <b>Email Subject</b>: subject of the email <br> |   8. <b>Email Subject</b>: subject of the email <br> | ||
| + | </p> | ||
| + | |||
| + | {|style="width:100%;vertical-align:top;margin-top:20px;" | ||
| + | |- | ||
| + | |style="vertical-align:top;width:30%;" | <div style="background: #10d0e5; padding: 13px; font-weight: bold; text-align:center; line-height: wrap_content; text-indent: 20px;font-size:20px; font-family:helvetica"> <font color= #ffffff>METHODOLOGY</font></div><br/> | ||
| + | <p> | ||
| + | |||
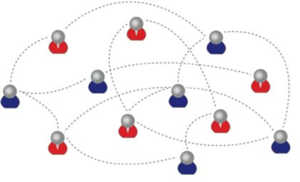
| + | We plan to take a social network analysis (SNA) approach to analyze the data since the goal is to analyze different attributes (preference to work in silos, importance, popularity) of the actors (employees) and the relationship between them (collaboration via email). This view of the data makes it an ideal social networks data when each email address would represent a node and every email would be the relationship between both the nodes. | ||
| + | <br><br> | ||
| + | <center> | ||
| + | [[Image:SN diagram.png|300px]] | ||
| + | </center> | ||
| + | <br><br> | ||
| + | There are various measures of SNA proposed over the years that help determine the role and importance of a node in the network. The following are a few examples: <br><br> | ||
| + | • Degree centrality <br> | ||
| + | • Closeness centrality <br> | ||
| + | • Betweenness centrality <br> | ||
| + | • Eigenvector centrality<br> | ||
| + | <br> | ||
| + | Our first step would be to explore the network using these centralities, identifying hubs, brokers and groups as well as delving into other SNA concepts discussed by various academic researchers. We would be using softwares such as UCINET and NETDRAW for these analysis.<br><br> | ||
| + | Our goal is to come up with our own hybrid centrality score that would quantify an overall importance of each node in the network. Using the insights from step one, we will be creating multiple surveys (source of additional data) for the employees at TrustSphere to find influences (for the hybrid centrality). During the process, we will be referencing to the work of Karen Stephenson and Rob Cross, both of whom specialize in the field of organizational social networks.<br><br> | ||
| + | In the end, along with the hybrid centrality score algorithm, we will be delivering a comprehensive dynamic dashboard visualizing the most relevant measures that we identify during our project. <br> | ||
| + | </p> | ||
| + | |||
| + | {|style="width:100%;vertical-align:top;margin-top:20px;" | ||
| + | |- | ||
| + | |style="vertical-align:top;width:30%;" | <div style="background: #10d0e5; padding: 13px; font-weight: bold; text-align:center; line-height: wrap_content; text-indent: 20px;font-size:20px; font-family:helvetica"> <font color= #ffffff>SCOPE OF WORK</font></div><br/> | ||
| + | <p> | ||
| + | 1. Create a hybrid centrality score as an overall comprehensive measure of the network <br> | ||
| + | 2. Identify Silos<br> | ||
| + | 3. Assess Collaboration<br> | ||
| + |   a. Within departments<br> | ||
| + |   b. Within different geographical regions<br> | ||
| + |   c. Within projects<br> | ||
| + | 4. Develop a dynamic dashboard to visualize relevant measures<br> | ||
| + | 5. The Scope is fluid and will become more specific as the project progresses <br> | ||
</p> | </p> | ||
Revision as of 22:23, 1 January 2017


