Difference between revisions of "Visualization of Consumer Satisfaction Project Overview"
Jump to navigation
Jump to search
MRT System
Public Buses
Taxi Services
Supermarkets
Hotels
Budget Airlines
| Line 1: | Line 1: | ||
<!-- Start of header --> | <!-- Start of header --> | ||
{|style="background-color:#FFFFFF; color:#FFFFFF padding: 5px 0 0 0;" width="100%" cellspacing="0" cellpadding="0" valign="top" border="0" | | {|style="background-color:#FFFFFF; color:#FFFFFF padding: 5px 0 0 0;" width="100%" cellspacing="0" cellpadding="0" valign="top" border="0" | | ||
| − | | style="padding:0.4em; font-size:120%; border-bottom:4px solid # | + | | style="padding:0.4em; font-size:120%; border-bottom:4px solid #B18904; border-top:5px solid #B18904; text-align:center; background-color:#FFFFFF; " width="10%" | [[Visualization of Market Trends | <font color="#0B0B61"><b>Home</b></font> ]] |
| − | | style="border-bottom:4px solid # | + | | style="border-bottom:4px solid #B18904; border-top:5px solid #B18904; background:none;" width="1%" | |
| − | | style="padding:0.4em; font-size:150%; background-color:#0B0B61; border-bottom:4px solid # | + | | style="padding:0.4em; font-size:150%; background-color:#0B0B61; border-bottom:4px solid #B18904; border-top:5px solid #B18904; text-align:center; color:#828282" width="10%" | [[Visualization of Market Trends Project Overview |<font color="#ffffff" size=2><b>Project Overview</b></font>]] |
| − | | style="border-bottom:4px solid # | + | | style="border-bottom:4px solid #B18904; border-top:5px solid #B18904; background:none;" width="1%" | |
| − | | style="padding:0.4em; font-size:150%; background-color:#FFFFFF; border-bottom:4px solid # | + | | style="padding:0.4em; font-size:150%; background-color:#FFFFFF; border-bottom:4px solid #B18904; border-top:5px solid #B18904; text-align:center; color:#828282" width="10%" | [[Visualization of Market Trends Documentation |<font color="#0B0B61" size=2><b>Documentation</b></font>]] |
|} | |} | ||
<!-- End of header --> | <!-- End of header --> | ||
Revision as of 13:55, 2 September 2014
| Home | Project Overview | Documentation |
Project Scope
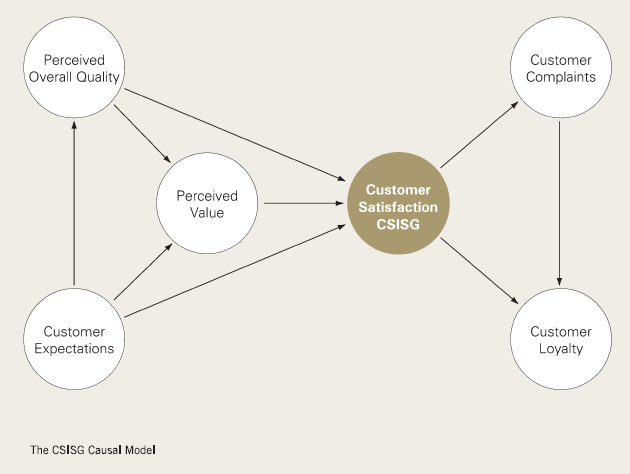
Consumer research has been a hot topic. Businesses and government agencies are interested to know the satisfaction levels of Singaporean consumers and effectively take actions that can create valuable and meaningful impact in the society. This project explores these satisfaction levels. It uses the respondent level data from the Customer Satisfaction Index of Singapore (2008-2013) for the following sub-sectors:
The metrics that measure satisfaction includes:

Note: Referenced from the CSISG Brochure
The objective of this project is to produce a dashboard that shows market trends visually.