Difference between revisions of "ANLY482 AY2016-17 T2 Group21 : PROJECT FINDINGS"
Jump to navigation
Jump to search
 total users
| Line 35: | Line 35: | ||
<div style="font-size:16px"><b>Understanding User Base</b></div> | <div style="font-size:16px"><b>Understanding User Base</b></div> | ||
| − | |||
<div>[[File:Userbreakdown.png|500px]] <b></b> total users | <div>[[File:Userbreakdown.png|500px]] <b></b> total users | ||
| Line 51: | Line 50: | ||
</div> | </div> | ||
| − | + | <hr> | |
<div style="font-size:16px"><b>Understanding User Growth</b></div> | <div style="font-size:16px"><b>Understanding User Growth</b></div> | ||
| − | |||
<div>[[File:userreg.png|500px]] | <div>[[File:userreg.png|500px]] | ||
Revision as of 01:44, 23 February 2017
Exploratory Data Analysis
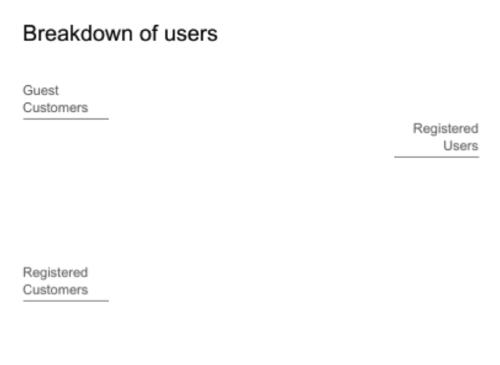
Understanding User Base
 total users
Findings: ⅓ of total users do not make purchases

Findings:
1. Top 25% of most valuable customers gives 72.52% of revenue
2. Top customers on average orders 12 times more than bottom tier customer
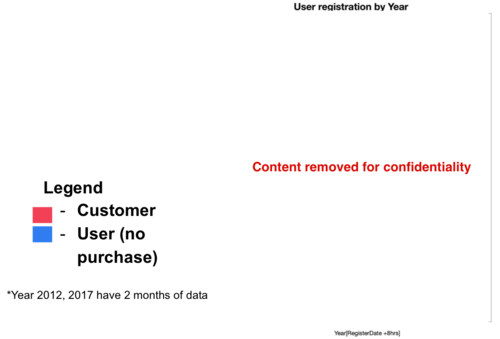
Understanding User Growth

Findings:
1. Huge growth in 2013-14
2. Large growth of non-buyers in 2016, possibility due to offline referral