Difference between revisions of "ANLY482 AY2016-17 T2 Group7: Project Findings"
Yx.lim.2013 (talk | contribs) |
Yx.lim.2013 (talk | contribs) |
||
| Line 27: | Line 27: | ||
<div style="background:#307FBB; line-height:0.3em; font-family:sans-serif; font-size:120%; border-left:#bbdefb solid 15px;"><div style="border-left:#fff solid 5px; padding:15px;"><font color="#fff"><strong>Findings</strong></font></div></div> | <div style="background:#307FBB; line-height:0.3em; font-family:sans-serif; font-size:120%; border-left:#bbdefb solid 15px;"><div style="border-left:#fff solid 5px; padding:15px;"><font color="#fff"><strong>Findings</strong></font></div></div> | ||
| − | + | <a href="#Analysis1">Analysis 1</a> | |
| − | <a href="#Analysis1">Analysis 1 | ||
<div style="color:#212121;"> | <div style="color:#212121;"> | ||
| − | <big | + | <big>'''Analysis 1: Insights on Search Count by Date:'''</big><br/> |
| + | |||
| + | <a name="Analysis1"></a> | ||
[[File:overall_search_count_by_month.jpg]]<br/> | [[File:overall_search_count_by_month.jpg]]<br/> | ||
Revision as of 18:42, 19 February 2017
<a href="#Analysis1">Analysis 1</a>
Analysis 1: Insights on Search Count by Date:
<a name="Analysis1"></a>
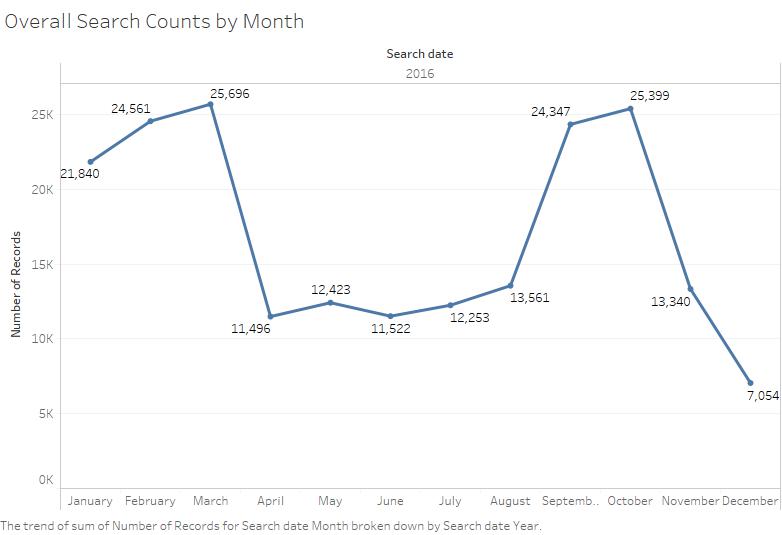
Chart 1: Overall Search Counts by Month
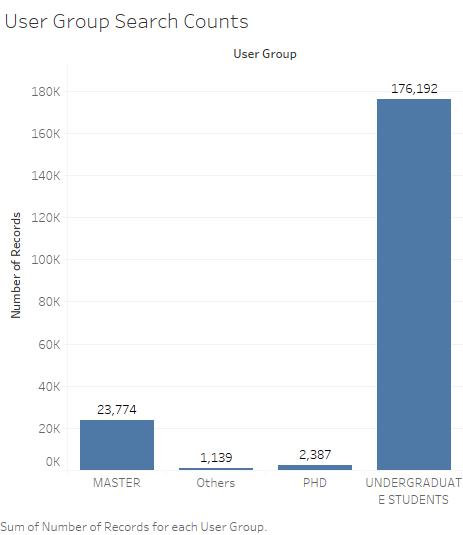
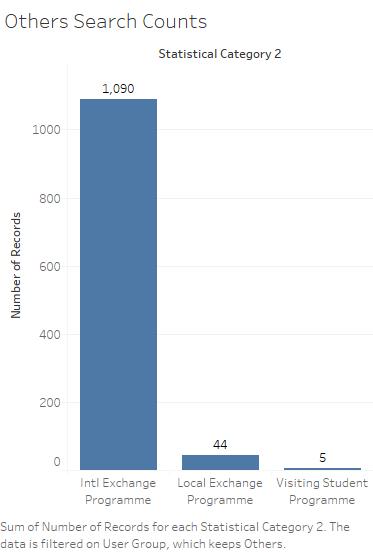
Chart 2: User Group Search Counts
Chart 3: Search Count of 'Others'
| Subject Matter: | Awareness of the number of searches throughout the year |
| Thought Process: | We want to understand the number of searches throughout the year and see if there are any observable trends. From our personal anecdotes as Seniors in SMU, we believe there will be a spike in searches especially during the project weeks (Week 4 onwards). Thus, we initiated the break down of the number of searches by months, to have a better look at where the peak periods are. |
| Analysis: | There is great variation in the number of searches across the span of a year, and these searches on the Ezproxy are contributed by students - Undergraduate, Masters, PhD and others (international exchange, local exchange, visiting students). As the users of the Ezproxy site are students of Singapore Management University, the spike in the number of searches can be seen during the months of the regular semesters (Term 1 and 2) - January to March and Mid-August to November.
|

Chart 4: Search Count by Days for Semester 1: Jan-March 2016

Chart 5: Search Count by Days for Semester 2: Aug-Nov 2016
| Subject Matter: | Understanding the students’ behaviours in searches during the semesters. |
| Thought Process: | In SMU, 1 of the common perception is that SMU students study all day everyday, even the weekends. Thus, we want to see if this perception of SMU students is indeed true.
Next, we want to see if there is a surge in searches when the semester reaches the week where group projects are released. This is because projects in SMU largely requires the students to perform desk research and 1 of the many places to do so is through the SMU library’s EzProxy e-resources database. |
| Analysis: | Dip in Weekend Searches
From the charts in Semesters 1 & 2, we noticed that there is a dip in the number of searches performed every weekend (Saturdays & Sundays). For example, there is a plunge in the number of searches on 16th of January (Saturday). Thus, this may show that the perception of SMU students studying all day everyday and even the weekends may be untrue. Or it could be that SMU students generally do not perform as many searches for their research on weekends. Release of Project Requirements in Week 4 Generally, the release of the project requirements would be on Week 4 of Term 2, which is 25 Jan - 31 Jan. From Chart 4, we can observe that there is a steep increase in the number of searches from 25 Jan which peaks at 26 Jan and then decreases steeply again to the end of Week 4, 31 Jan. Contrastingly, for Term 1, the release of the project requirements would be on Week 4, which is 5 Sep - 11 Sep. From Chart 5, we can observe there is no major increase in the number of searches from 5 Sep - 11 Sep. Thus this not may explain that our belief that students did their searches in the week the project requirements are released. Research on Recess Week? However, upon further contrasting of the trends in Charts 4 and 5 side-by-side, we discovered that there is always a spike in the number of searches on the first day of Recess week in both Terms. For Term 2, Recess week starts on 22 Feb where there is a visible spike from 21 Feb to 22 Feb. And for Term 1, Recess week starts on 3 Oct where there is also a visible spike from 2 Oct to 3 Oct (this spike happens to be the highest in the entire Term 1). And in both cases, the number of searches decreases gradually until the end of the Recess Week (28 Feb for Term 2 and 9 Oct for Term 1 respectively). This is a very interesting discovery as it potentially shows that students typically start their research on the first day of Recess week, thereby contributing to the spike in number of searches, and then as the Recess week comes to a close, the amount of research students performed becomes lesser too. Highest Spike in Term 2: 11 Feb, end of CNY? From Chart 4, we observed the highest spike in Term 2, which takes place on 11 Feb 2016. We could not find a possible explanation for this other than it being the end of the Chinese New Year holidays (9 & 10 Feb 2016) and students may be guilty from enjoying their CNY a tad too much and thus began to do their research on the library databases on 11 Feb. Identifying the start and end of regular terms just by looking at the number of searches In both Charts 4 & 5, we could potentially identify the start and end of the 2 regular terms just by observing where the number of searches experience a gradual dip. The overall trend of the number of searches forms the shape of a jagged mountain for both terms, thus the start and ends of the mountains fall around the start and ends of the terms.
|
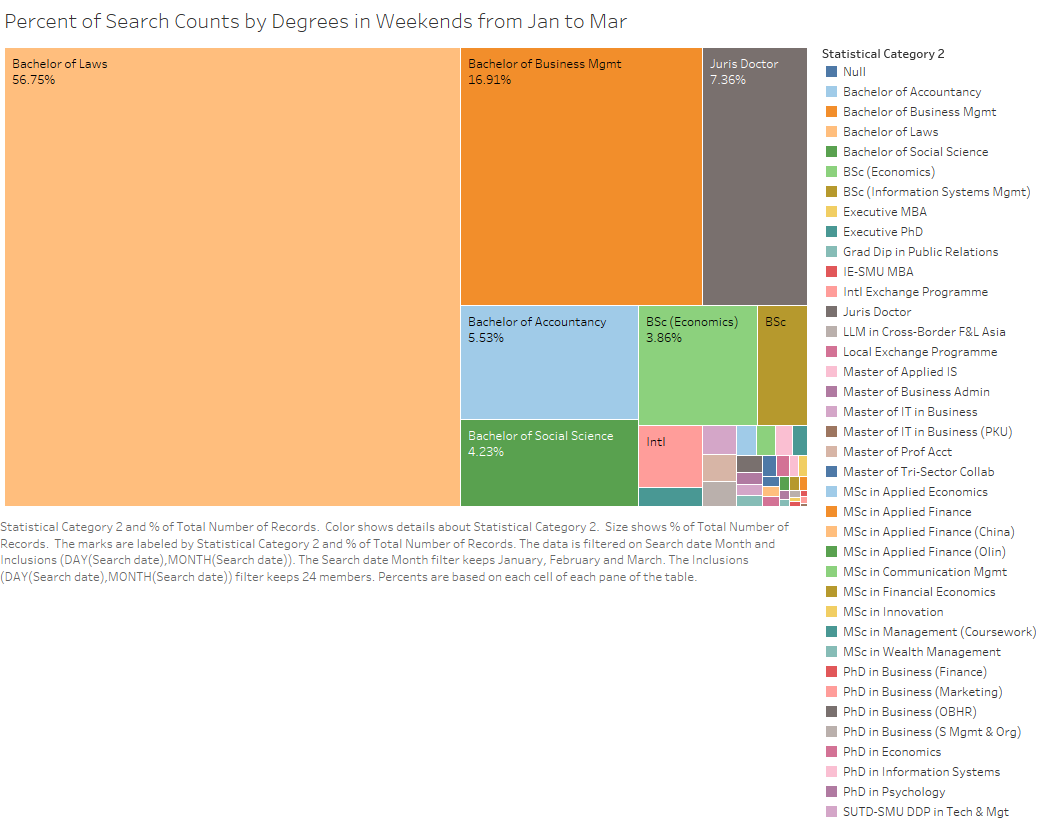
Chart 6: Percentage of Search Counts by Degrees in Weekends for Semester 2: Jan-March 2016
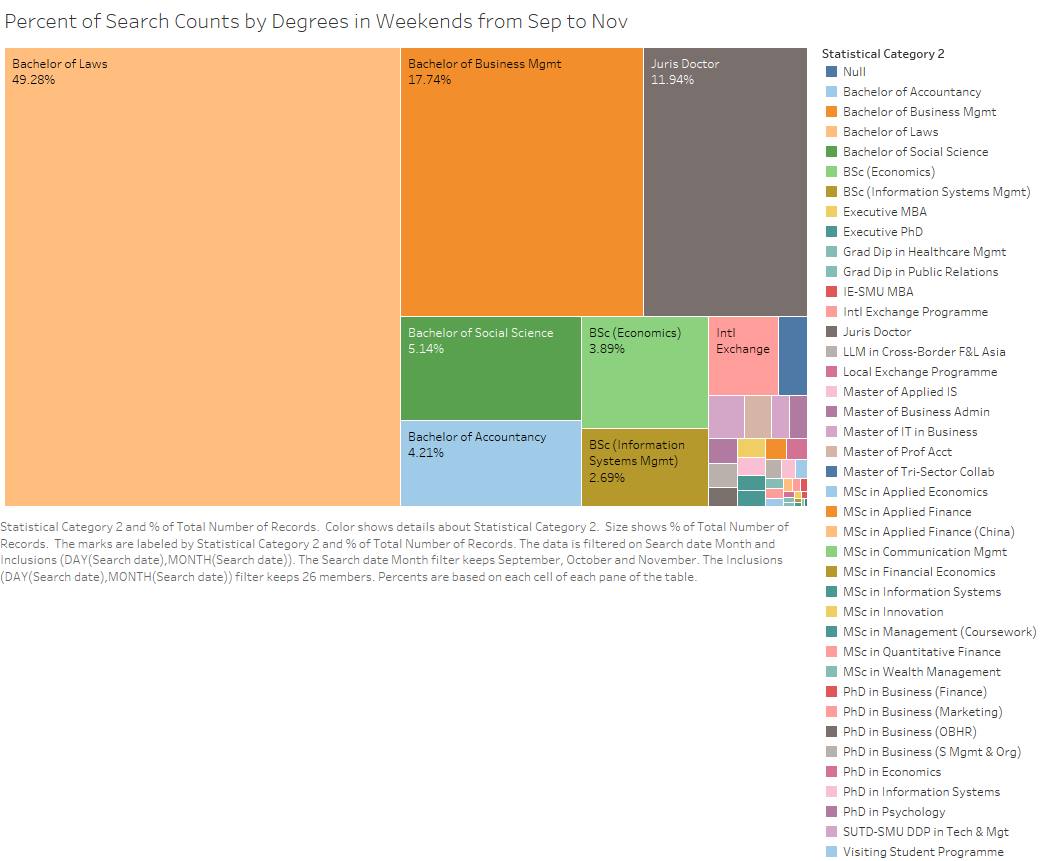
Chart 7: Percentage of Search Counts by Degrees in Weekends for Semester 1: Sep to Nov 2016
| Subject Matter: | Understanding the percentage of searches contributed by students across their Degrees during weekends |
| Thought Process: | We want to dive deeper into the analysis of weekend searches and find out who are the ones still contributing to it, despite the dip in number of weekend searches. |
| Analysis: | In Chart 6, we noticed that 56.75% of searches were done by students enrolled in the Bachelor of Laws programme, which occupies a majority of the total number of searches performed on weekends. Additionally, 16.91% of searches were done by students from Bachelor of Business Management and 7.36% from the Juris Doctor programme.
One of the possible conclusions from this observation is that students enrolled in the Law field (Bachelor of Laws & Juris Doctor programme) do not typically stop performing searches and/or stop researching simply because it is the weekends. In addition to that, students in the Bachelor of Business Management programme contributes significantly to the number of searches on weekends too, perhaps due to the nature of the programme which is research-intensive. This is in contrast to students from other non-research intensive programmes such as Bachelor of Science (Information Systems) at 1.64% of total number of searches. In Chart 7, we can observe that the abovementioned trend is consistent for students in the Bachelor of Laws, Bachelor of Business Management and Juris Doctor. Thus, our trend analysis holds consistent for both Semesters 1 and 2.
|
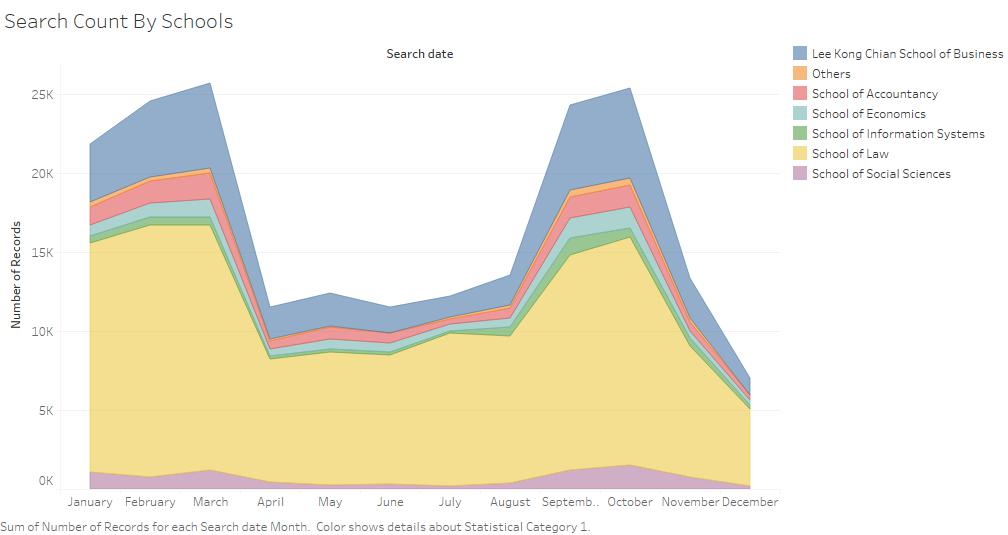
Chart 8: Search Count by Schools for 2016
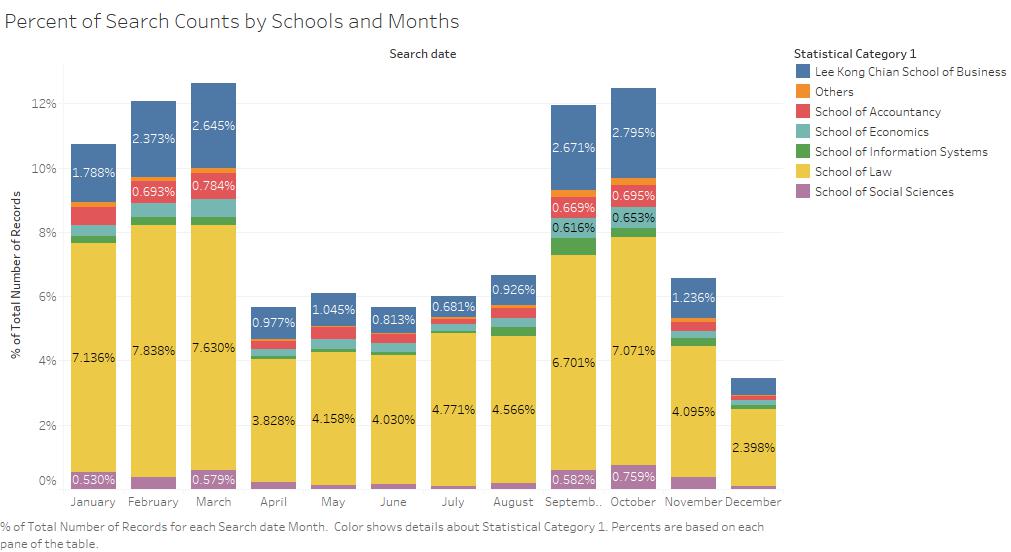
Chart 9: Percentage of Search Counts by Schools & Months
| Subject Matter: | Understanding the percentage of searches contributed by students across their Degrees for 2016 |
| Thought Process: | After learning about the different spikes as a whole, we then consider the possibility of some schools being greater contributors to the searches. The main contributors to these searches should most likely be similar to that of the weekends, and thus, we broke down the search count by schools over the months to analyze the general trend of searches across each degree. |
| Analysis: | Similar to the weekend searches, we observed that the top 3 percentages of searches still come from the students enrolled in the Bachelor of Laws, Bachelor of Business Management and Juris Doctor.
In Chart 8, we observed that even though Semester 1 and Semester 2 starts in Aug and Jan respectively, the total number of searches in Jan is significantly higher than that of Aug. This is where additional information such as the exact dates of the start of Semesters 1 & 2 comes in handy; Semester 2 starts on 4 Jan 2016, thereby occupying the entire month of Jan whereby Semester 1 starts only on 15 Aug 2016, thereby occupying only half of the month of Aug. Without such additional information, analysts may conclude that perhaps students in Semester 2 are more hardworking than in Semester 1 in terms of the number of searches they perform.
|
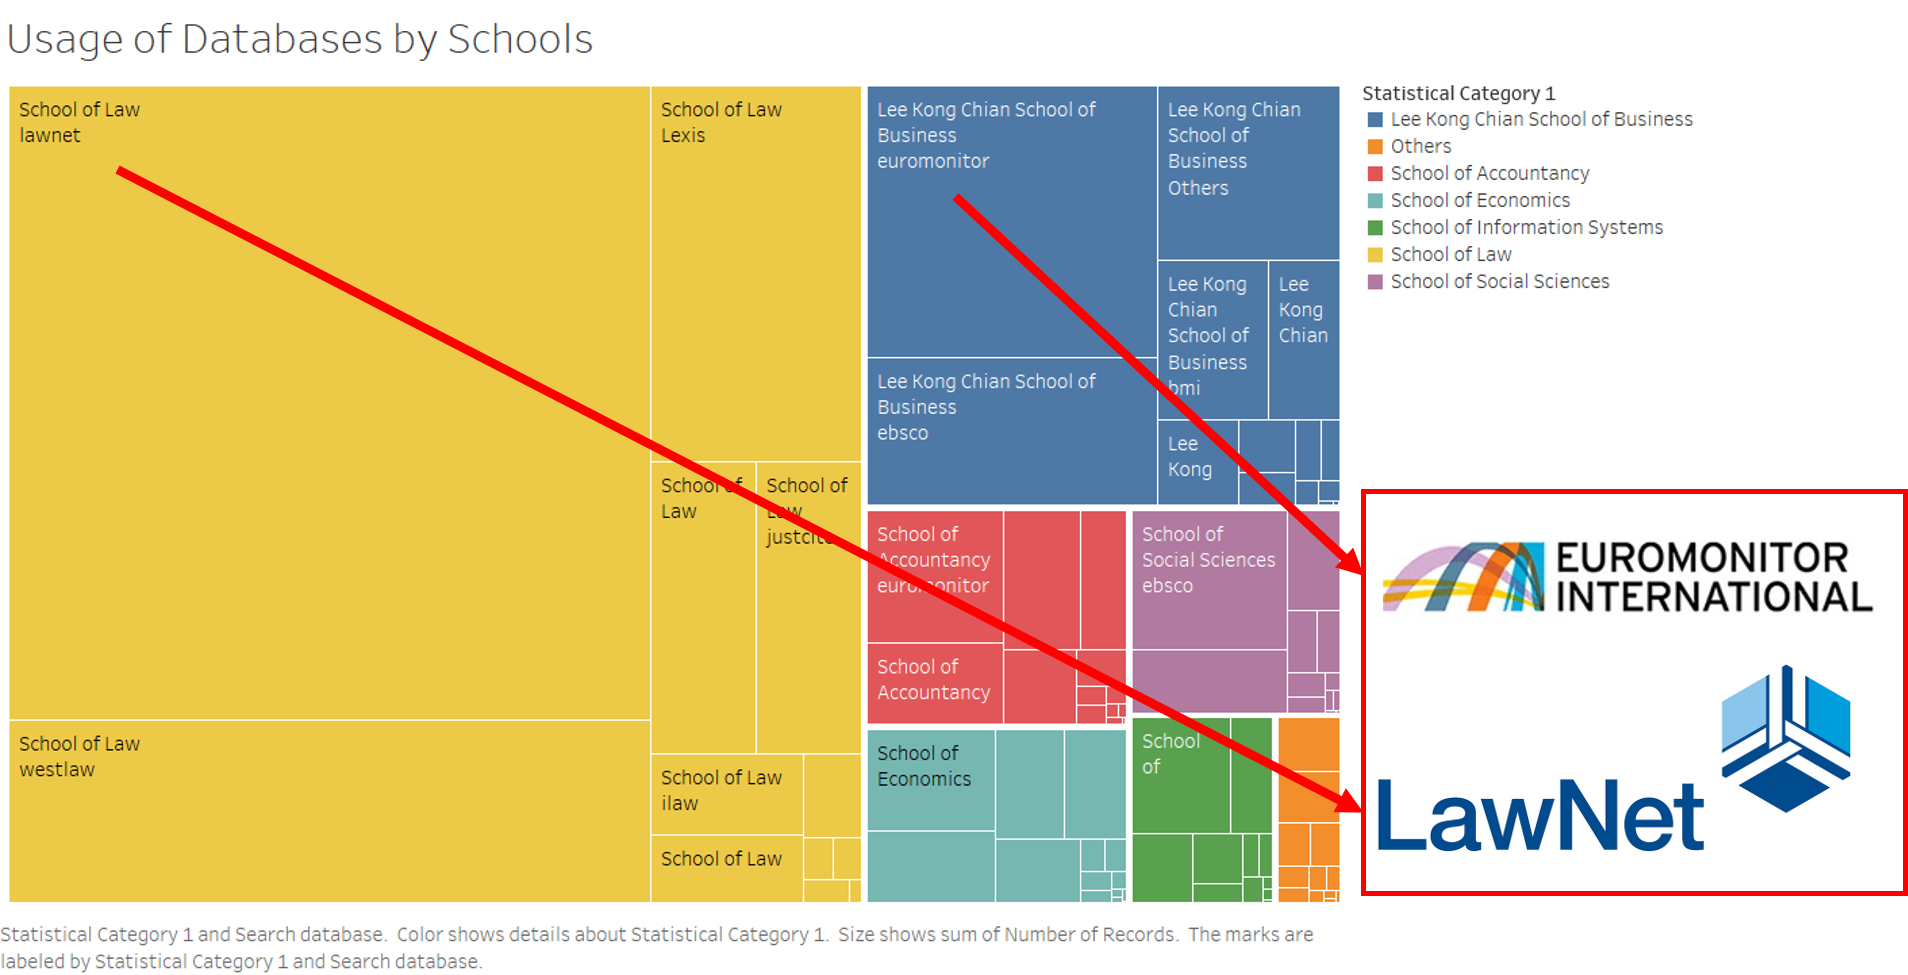
Chart 10: Usage of Database by Schools
With reference to Chart 10, we have selected 2 databases, Lawnet and Euromonitor, to focus on for this interim phase. This is due to the fact that these 2 databases are the most commonly used amongst the Law and Business students respectively, as these 2 schools are the 2 biggest contributors to the searches during the semester.
From the following actions applied to these 2 databases, we could then repeat these steps for the rest of the databases in the next phase following the interim report.
Excessive System Logging of Search Queries
In our EDA, we discovered that there exists a problem of excessive system logging of search queries. We have found 2 examples of such occurrence:
| Time | Search Query Logged |
|---|---|
| 12:55:02PM | Re |
| 12:55:04PM | Resol |
| 12:55:06PM | Resoluti |
| 12:55:08PM | Resolution |
Example 1: Log data is logged every 2 second
| Key Press | Search Query Logged |
|---|---|
| 1st Key Press: T | T |
| 2nd Key Press: r | Tr |
| 3rd Key Press: u | Tru |
| 4th Key Press: m | Trum |
| 5th Key Press: p | Trump |
Example 2: Log Data is logged with every key press
In our analysis, these presents a problem to us in the form of how do we determine which is the actual search query that a User is searching for? As illustrated by the example by ‘User A’ below, in a single session logged by ‘User A’, there may be multiple search queries searched by users. In this case, we used 3 search queries as an example. The challenge to us is to sieve out which are the search queries (eg. Jack, Singapore) that User A is searching for when it is not the end of the session for him.
Eg. List of 3 Search Queries being logged with every key press by User A:
[ Start of Session for User A ]
Re
Regu
Regula
Regulati
Regulation
Ja
Jack
Si
Sing
Singap
Singapor
Singapore
[ End of Session for User A ]
We decided that this shortfall not only affects us as project analysts, but to other stakeholders as well.
Interim Gap Analysis by Stakeholders
The Actual Performance in this case would be if everything remains status quo, meaning the problem of multiple logging of search queries would persist.
The Desired Performance in this case would be if this problem does not exist and 1 line of logging is created for 1 full, actual search query.
| Stakeholders Involved/Impact of Performance | Actual Performance | Desired Performance |
|---|---|---|
| Our Team as Project Analysts | Presents a problem whereby we need to find out how to determine which line of search query logged is the actual, full search query by end-users so that we can begin the analysis from there | Every line of search query would be the actual, full search query by end-users so we need not clean the dataset even further, thereby reducing the amount of work we have to do and saves time which can be better spent in progressing the analysis |
| End-Users of Library’s e-Resources | Presents a problem whereby end-users may experience unnecessary lag in obtaining the results from their search queries | No lag when completing searches would mean a better overall user experience. Furthermore, such seamless experience would mean that the system do not stand in the way of the intensive research that students have to do in their course of study, but rather serving as an effective aid to them. |
| Library Team as Project Sponsors for this Practicum | Presents a problem whereby the project sponsors run a risk of the project analysts not being able to sieve out the line of search queries which are full, actual and useful to determine the accurate search queries that users are actually searching for | No such problem as whatever the search query is, it would be logged as exactly that. |
| Library Team in charge of ensuring that the EzProxy server serves the users in the best possible way | Wastage of resources and can potentially slow down the servers when multiple logs are triggered and recorded before searches are completed. This utilizes processing RAM of the server unnecessarily and takes up precious memory space when being recorded as a line of search query. | There would be no wastage of server’s processing RAM and memory space as 1 line of logging would be created for 1 full, actual search query entered by users. |