Difference between revisions of "AY1516 T2 Team13 Natasha Studio Findings LogReg"
Amy.tan.2012 (talk | contribs) |
Amy.tan.2012 (talk | contribs) |
||
| (3 intermediate revisions by the same user not shown) | |||
| Line 58: | Line 58: | ||
<h4>Results</h4> | <h4>Results</h4> | ||
[[File: ResultsOpenClass.png|LogRegResults for Open Class|600px]] | [[File: ResultsOpenClass.png|LogRegResults for Open Class|600px]] | ||
| − | <p> The logistic regression result obtained from SAS EG is shown the table above. Firstly, looking at the test for global null hypothesis, the highest p-value is 0.0075. Using a significance level of 5%, the p-value is lower than the significance level and hence null hypothesis is rejected. We conclude that open class utilization rate does explain the probability of open class repurchase and beta is not equal to 0. </p> | + | <p> The logistic regression result obtained from SAS EG is shown the table above. Firstly, looking at the test for global null hypothesis, the highest p-value is 0.0075. Using a significance level of 5%, the p-value is lower than the significance level and hence null hypothesis is rejected. We conclude that open class utilization rate does explain the probability of open class repurchase and beta-1 is not equal to 0. </p> |
[[File: LogRegEqn Open.png|LogRegEqn for Open Class|400px]] | [[File: LogRegEqn Open.png|LogRegEqn for Open Class|400px]] | ||
<p> This gives us the equation above, which shows that for a 1% increase in utilization rate, we see a 3% increase in odds of repurchasing the open class package. </p> | <p> This gives us the equation above, which shows that for a 1% increase in utilization rate, we see a 3% increase in odds of repurchasing the open class package. </p> | ||
| Line 84: | Line 84: | ||
[[File: ResPro Open.png|Response Profile for Open Class|350px]] | [[File: ResPro Open.png|Response Profile for Open Class|350px]] | ||
<p> Looking at the predicted probability for Open Class Repurchase as shown in Figure 35, it is observed that the probability of repurchasing is low even if the package is fully utilized. This is likely to be caused by the low number of repurchase for open class package in the model as shown in Table 38. In conclusion, the logistic regression shows that a 1% increase in open class utilization rates increase the odds of open class repurchase by 3%. This indicates that there is a positive relationship between open class utilization rate and repurchase probability. However, even if the open class package is fully utilized, the probability of repurchasing the open class is still quite low at 25%. Hence, the relationship between open class utilization and repurchase probability for Natasha Studio is not strong, albeit a positive one. </p> | <p> Looking at the predicted probability for Open Class Repurchase as shown in Figure 35, it is observed that the probability of repurchasing is low even if the package is fully utilized. This is likely to be caused by the low number of repurchase for open class package in the model as shown in Table 38. In conclusion, the logistic regression shows that a 1% increase in open class utilization rates increase the odds of open class repurchase by 3%. This indicates that there is a positive relationship between open class utilization rate and repurchase probability. However, even if the open class package is fully utilized, the probability of repurchasing the open class is still quite low at 25%. Hence, the relationship between open class utilization and repurchase probability for Natasha Studio is not strong, albeit a positive one. </p> | ||
| + | |||
| + | <h2>Courses</h2> | ||
| + | <h3>Utilization Rate</h3> | ||
| + | [[File: CourseStat.png|CourseStat|600px]] | ||
| + | <p> After obtaining the utilization rate, the utilization rate analysis is shown in the table above. The table shows that the average course utilization rate is 63%, which is similar to the utilization rate of open class at 65%. Meanwhile, it can also be observed that the range of course utilization rate is same as open class, where the maximum and minimum utilization rate is 100% and 0% respectively. The spread is slightly higher for course utilization than open class as the standard deviation is slightly higher at 0.298. </p> | ||
| + | |||
| + | <h3>Logistic Regression</h3> | ||
| + | <p> Next, logistic regression is performed to examine if the course utilization rate explains the probability of course package repurchase. The table below lists the variables involved in the logistics regression model and its hypotheses. The setting of SAS EG is also adjusted where the probability output is modelled for “Repurchase = 1”.</p> | ||
| + | [[File: LogRegCourse.png|LogReg for Course|600px]] | ||
| + | <h4>Results</h4> | ||
| + | [[File: ResultsCourse.png|LogRegResults for Courses|600px]] | ||
| + | <p> The logistic regression result obtained from SAS EG is shown in the table above. Firstly, looking at the test for global null hypothesis, the highest p-value is 0.3174. Using a significance level of 5%, the p-value is much higher than the significance level and hence null hypothesis is not rejected. We conclude that course utilization rate does not explain the probability of course repurchase and beta is equal to zero. </p> | ||
| + | |||
| + | <h4>Evaluating fit of model</h4> | ||
| + | Furthermore, the fit of the logistic regression model is also evaluated to confirm the conclusion that the model is not a good fit for course package utilization and repurchases. | ||
| + | |||
| + | <h5>Area under ROC Curve</h5> | ||
| + | [[File: ROC Course.png|ROC Curve for Course|450px]] | ||
| + | <p> The area under ROC curve is 0.5225 as shown in the figure above, which is close to 0.5. This shows that the model is not much better than chance at predicting membership within the group. Hence, this shows that the model is not a good fit in understanding the relationship between course package utilization rates and repurchase.</p> | ||
| + | |||
| + | <h5>Odds Ratio Estimate</h5> | ||
| + | [[File: OddsRatio Course.png|Odds Ratio for Course|400px]] | ||
| + | <p> As we see in the table above, the odds ratio 95% confidence interval contains 1 and hence can conclude once again that the course utilization rate does not have an effect on the course repurchase variable. </p> | ||
| + | |||
| + | <h5>Pair Concordant and Pair Disconcordant</h5> | ||
| + | [[File: Pairs Course.png|Pairs Concordant for Course|450px]] | ||
| + | <p> As seen in the table above, there is only 50.7 % concordant pairs which is almost equals to the percentage of discordant pairs. Hence this indicates that the model is not suitable for course package repurchase and utilization. </p> | ||
| + | |||
| + | <h5>Conclusion</h5> | ||
| + | <p> In conclusion, the logistic regression shows that there is no association between the course package utilization and package repurchase probability. The high p-value shows that the model is not statistically significant. This corroborates with the evaluation of model which indicates that the model is not a good fit in explaining the relationship between course utilization rate and course repurchase package. Hence, course repurchase probability cannot be explained by course package utilization rate. </p> | ||
| + | |||
| + | <h2>Unlimited 1 Month Package</h2> | ||
| + | <h3>Utilization Rate</h3> | ||
| + | [[File: UnlimitedStat.png|UnlimitedStat|600px]] | ||
| + | <p> After obtaining the utilization rate, the utilization rate analysis is shown in table above. The table shows that the average course utilization rate is 7%, which is very low compared to the utilization rates of open class and courses. Moreover the maximum is at 26%, much lower than the maximum of open class and course utilization of 100%. The significantly lower utilization rate is because of the much higher number of lessons offered by Natasha Studio in 1 month compared to the number of lessons attended by members. For instance, the average number of lessons offered by Natasha Studio is 176, while members only attend 13 lessons on average per month. </p> | ||
| + | |||
| + | <h3>Logistic Regression</h3> | ||
| + | <p> Next, logistic regression is performed to examine if the unlimited 1 month package utilization rate explains the probability of unlimited 1 month package repurchase. The table below lists the variables involved in the logistics regression model and its hypotheses. The setting of SAS EG is also adjusted where the probability output is modelled for “Repurchase = 1”. </p> | ||
| + | [[File: LogRegUnlimited.png|LogReg for Unlimited|600px]] | ||
| + | <h4>Results</h4> | ||
| + | [[File: ResultsUnlimited.png|LogRegResults for Unlimited|600px]] | ||
| + | <p> The logistic regression result obtained from SAS EG is shown in Table 52. Firstly, looking at the test for global null hypothesis, the highest p-value is less than 0.001. Using a significance level of 5%, the p-value is less than the significance level and hence null hypothesis is rejected. We conclude that unlimited 1 month utilization rate does explain the probability of course repurchase and beta-1 does not equal to 0. | ||
| + | </p> | ||
| + | [[File: LogRegEqn Unlimited.png|LogRegEqn for Unlimited|400px]] | ||
| + | <p> This gives us the equation above, which shows that for a 1% increase in utilization rate, we see a 17% increase in odds of repurchasing the open class package. </p> | ||
| + | |||
| + | <h4>Evaluating fit of model</h4> | ||
| + | Next, the fit of the logistic regression model is evaluated to confirm that the model is a good fit for the above equation. | ||
| + | |||
| + | <h5>Area under ROC Curve</h5> | ||
| + | [[File: ROC Unlimited.png|ROC Curve for Unlimited|450px]] | ||
| + | <p> The area under ROC curve is 0.7519 as shown in the figure above, which is more than the criteria of 0.7. Hence, this indicate that the fit of the model is good. </p> | ||
| + | |||
| + | <h5>Odds Ratio Estimate</h5> | ||
| + | [[File: OddsRatio Unlimited.png|Odds Ratio for Unlimited|400px]] | ||
| + | <p> As we see in the table above, the odds ratio 95% confidence interval does not contain 1 and hence we can conclude that the unlimited 1 month package utilization rate has an effect on the unlimited 1 month repurchase variable.</p> | ||
| + | |||
| + | <h5>Pair Concordant and Pair Disconcordant</h5> | ||
| + | [[File: Pairs Unlimited.png|Pairs Concordant for Unlimited|450px]] | ||
| + | <p> The model has a 75.2% concordant pairs as seen in the table above, which is a high percentage. This once again indicates that the fit of model is good. </p> | ||
| + | |||
| + | <h5>Predicted Probability</h5> | ||
| + | [[File: PP Unlimited.png|Predicted Probabilities for Unlimited|450px]] | ||
| + | <p> Looking at the predicted probability for Unlimited 1 Month Package as shown in Figure 38, it is observed that the probability of repurchasing the unlimited 1 month package increases as the utilization of the package increases. This indicates that there is a positive relationship between unlimited utilization rate and repurchase probability.</p> | ||
| + | |||
| + | <h2>Limitations</h2> | ||
| + | {| class="wikitable" | ||
| + | |- | ||
| + | ! Limitations !! Reason !! Impact | ||
| + | |- | ||
| + | | Members who bought both course and unlimited 1 month packages, and open classes and unlimited 1 month packages are excluded from the model. || The ability to accurately track package utilization is affected if package overlaps, as it would create inflate the total number of lessons purchased by the members. || This reduced the member sample size included in the model. | ||
| + | |- | ||
| + | | Members whose packages “date start” and “date end” are missing are excluded. | ||
| + | || This is due to the inconsistent data-recording methods in the hardcopy records. To ensure standardized analysis, members with missing observations in these two columns are excluded from the analysis. || This results in abnormally high utilization rates for some members, as their total number of lessons purchased might not be accounted for. This is mitigated by removing members with utilization rates more than 100%. | ||
| + | |- | ||
| + | | Classes held at the same time are included in total class purchased by member, even though it is not possible for a person to attend more than 1 lesson at the same time. || This is due to the inconsistent data-recording methods, which resulted in missing timing data for some lessons. As such, lessons cannot be accurately ascertained if they are held at the same time. ||It was confirmed with Natasha Studio that there are low occurrence of classes held at the same time. Hence, even though this inflates the total number of lessons purchased by members, it is unlikely to affect utilization rate significantly. | ||
| + | |- | ||
| + | | Purchase data affected by the size of attendance data | ||
| + | || The analysis require the purchase and attendance data to be aligned in terms of time period to accurately calculate utilization rate. || As attendance data is shorter in terms of time period, purchase data has been scoped accordingly, which reduces the member sample size included in the model. | ||
| + | |} | ||
| + | |||
| + | <h2>Business Recommendations</h2> | ||
| + | The significant finding from conducting logistic regression on all three package types offered by Natasha Studio reveals that an increase in unlimited 1 month package utilization rate increases the odds of repurchasing the package significantly. This finding is not applicable for open class and course packages, where open class has shown a low probability of package repurchase despite full package utilization while the latter has shown that there is no association between course utilization rate and package repurchase. | ||
| + | <br><br>The finding is especially relevant for Natasha Studio, as it has previously been shown that there is a decrease in package purchases towards the end of 2015 in Purchase data as seen in our Exploratory Data Analysis. Moreover, Unlimited 1 Month package was also shown to be the most popular package amongst members as shown in Figure 10. Therefore, this signals a great potential for Natasha Studio to improve their business performance, taking into consideration of its waning purchases. | ||
| + | <br><br>In light of this finding, it is recommended that Natasha Studio keep track of their members’ utilization rates for the unlimited 1 month package consistently and frequently. This business action would also be greatly supported by the database solution mentioned earlier, as it would allow Natasha Studio to keep clear records of the members’ attendance and their package related information, both which are necessary to track the members’ package utilization rates. Upon identifying members with low utilization rates, Natasha Studio could take appropriate action to improve utilization rates. One possible example could be to remind members’ of their on-going packages. In addition, Natasha Studio should also identify methods that could improve the unlimited 1 month package utilization rates effectively. A suggestion would be to conduct survey amongst members to identify causes for low utilization rates, so that targeted solutions can be implemented. | ||
Latest revision as of 15:13, 17 April 2016
| EXPLORATORY DATA ANALYSIS | OTHER ANALYSIS | DATABASE CREATION | ASSOCIATION RULE MINING | LOGISTIC REGRESSION |
|---|
Contents
Data Transformation
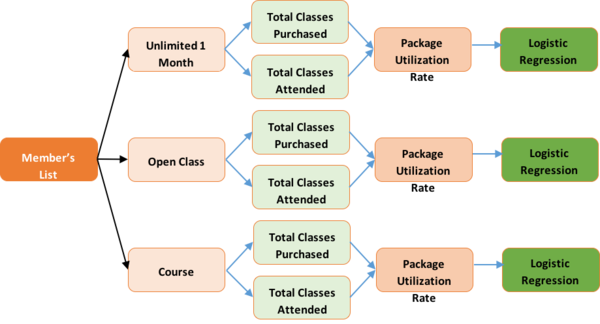
Before conducting logistic regression, data transformation is required to obtain the members’ package utilization rate. Figure 33 shows the process of data transformation before logistic regression can be performed. Microsoft Excel is the primary tool for such data transformation and utilization analysis.
Firstly, the Attendance data and Purchase data are aligned in terms of time period. The alignment is necessary as the variable “Total Classes Attended” is obtained from the Attendance dataset, while the “Total Classes Purchased” is obtained from the Purchases dataset. As the Attendance data provided by Natasha Studio runs from March 2014 to March 2015, the Purchases data involved in this analysis is thus scoped accordingly.
Furthermore, in the Purchase data, the “DateStart” and “Date End” variables are missing for some of the records. “DateStart” indicate the dates which the members activate their purchased packages, while “Date End” indicates the dates where the package validity would end. These two dates are different from the “DatePurchased” variable which indicates the date when the member purchase the packages. This means that the package purchasing date is independent of the package utilization dates.
During the data preparation stage earlier, it was found that there are significant amount of missing data for the “DateStart” and “Date End” variables. A clear package start date and end date is important so as to calculate the total number of lessons purchased by members accurately. As such, members whose “DateStart” and “Date End” variables are missing are excluded from the model. Next, the Purchase data is filtered into “Course Purchase”, “Open Class Purchase” and “Unlimited 1 Month Purchase”. For instance, “Open Class Purchase” contains all open class course purchases within the period from March 2014 to March 2015. We focused the analysis for unlimited package on the unlimited 1 month package as it makes up 96% of all unlimited packages bought within this time period Next, members’ lists are created for each of the package type based on the “COUNTIF” function to identify members who purchased each of the three packages.
Open Class
Utilization Rate
After obtaining the utilization rate, an analysis for utilization rate is shown in the table above. The table shows that the average open class utilization rate is 65%. Meanwhile, it can also be observed that the range of open class utilization rate is high, as the maximum and minimum utilization rate is 100% and 0% respectively. The open class utilization rate is also skewed towards the higher end, where the 80th percentile is also 100%.
Logistic Regression
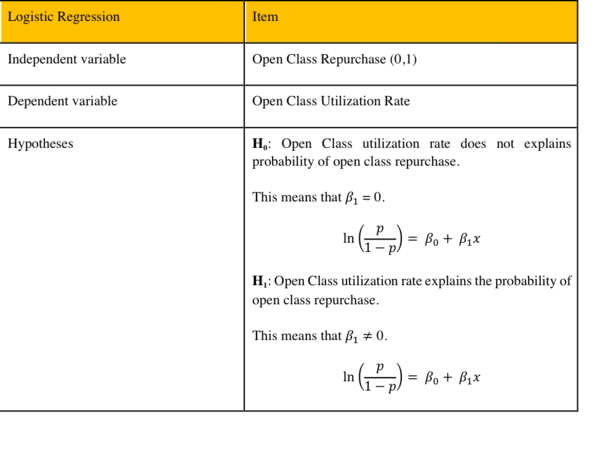
In order to ascertain if open class package utilization rate can explain the open class package repurchase, a logistic regression is performed. The table below lists the variables involved in the logistics regression model and its hypotheses. The setting of SAS EG is also adjusted where the probability output is modelled for “Repurchase = 1”.
Results
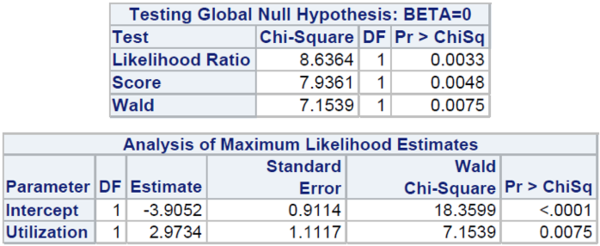
The logistic regression result obtained from SAS EG is shown the table above. Firstly, looking at the test for global null hypothesis, the highest p-value is 0.0075. Using a significance level of 5%, the p-value is lower than the significance level and hence null hypothesis is rejected. We conclude that open class utilization rate does explain the probability of open class repurchase and beta-1 is not equal to 0.
This gives us the equation above, which shows that for a 1% increase in utilization rate, we see a 3% increase in odds of repurchasing the open class package.
Evaluating fit of model
Next, the fit of the logistic regression model is evaluated based on the following measures:
- Area under ROC curve
- Odds Ratio Estimate
- Pair concordant and pair disconcordant
Area under ROC Curve
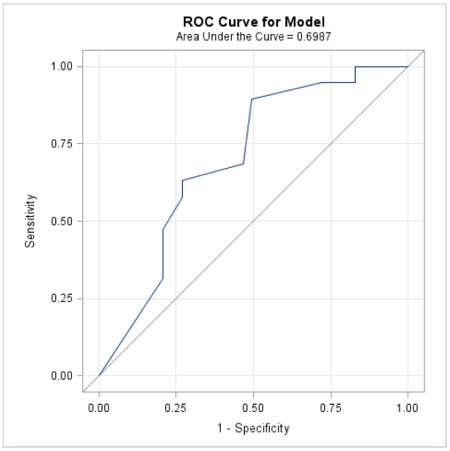
A model that has area under ROC curve higher than 0.7 are considered reasonable and considered strong if the value exceeds 0.8. The area under ROC curve is 0.6987 as shown the figure above, which is very close to the criteria of 0.7. Hence, this indicate that the fit of the model is reasonable.
Odds Ratio Estimate
A model that has a 95% confidence interval of odds ratio which contains 1 is not statistically significant that there is an association between the dependent variable and the independent variable. This is because the odds ratio of 1 means that there is the independent variable has no effect on the dependent variable. As we see in the table above, the odds ratio 95% confidence interval does not contain 1 and hence can conclude that the open class utilization rate has an effect on the open class repurchase variable.
Pair Concordant and Pair Disconcordant
Percent concordant is the percentage of pairs in which the model estimates a higher probability for the member with the higher response (i.e. member who have higher utilization rate has a higher probability of repurchasing the package). Percent discordant is the contrary of percent concordant. This means that a high percentage of concordant pairs indicates a good-fit for the model. As our model has a 64.9% of concordant pairs as seen the table above, which is a moderately high percentage, this once again indicates that the fit of model is reasonable.
Predicted Probability
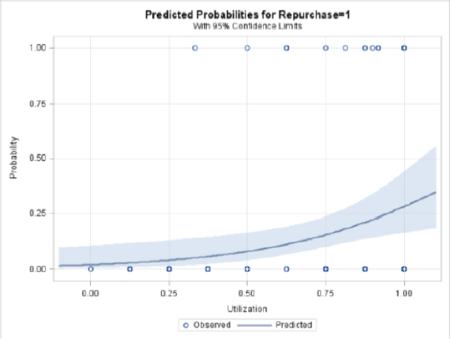
Looking at the predicted probability for Open Class Repurchase as shown in Figure 35, it is observed that the probability of repurchasing is low even if the package is fully utilized. This is likely to be caused by the low number of repurchase for open class package in the model as shown in Table 38. In conclusion, the logistic regression shows that a 1% increase in open class utilization rates increase the odds of open class repurchase by 3%. This indicates that there is a positive relationship between open class utilization rate and repurchase probability. However, even if the open class package is fully utilized, the probability of repurchasing the open class is still quite low at 25%. Hence, the relationship between open class utilization and repurchase probability for Natasha Studio is not strong, albeit a positive one.
Courses
Utilization Rate
After obtaining the utilization rate, the utilization rate analysis is shown in the table above. The table shows that the average course utilization rate is 63%, which is similar to the utilization rate of open class at 65%. Meanwhile, it can also be observed that the range of course utilization rate is same as open class, where the maximum and minimum utilization rate is 100% and 0% respectively. The spread is slightly higher for course utilization than open class as the standard deviation is slightly higher at 0.298.
Logistic Regression
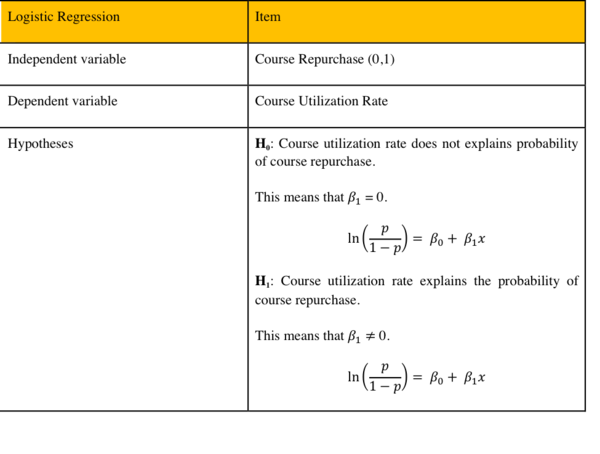
Next, logistic regression is performed to examine if the course utilization rate explains the probability of course package repurchase. The table below lists the variables involved in the logistics regression model and its hypotheses. The setting of SAS EG is also adjusted where the probability output is modelled for “Repurchase = 1”.
Results
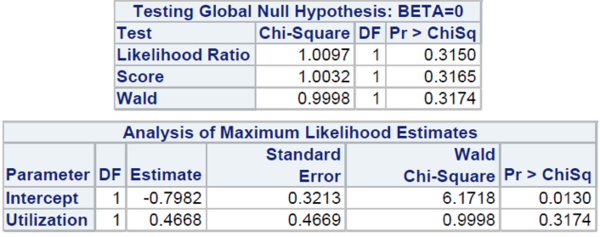
The logistic regression result obtained from SAS EG is shown in the table above. Firstly, looking at the test for global null hypothesis, the highest p-value is 0.3174. Using a significance level of 5%, the p-value is much higher than the significance level and hence null hypothesis is not rejected. We conclude that course utilization rate does not explain the probability of course repurchase and beta is equal to zero.
Evaluating fit of model
Furthermore, the fit of the logistic regression model is also evaluated to confirm the conclusion that the model is not a good fit for course package utilization and repurchases.
Area under ROC Curve
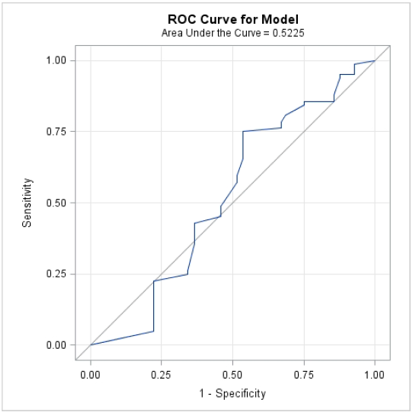
The area under ROC curve is 0.5225 as shown in the figure above, which is close to 0.5. This shows that the model is not much better than chance at predicting membership within the group. Hence, this shows that the model is not a good fit in understanding the relationship between course package utilization rates and repurchase.
Odds Ratio Estimate
As we see in the table above, the odds ratio 95% confidence interval contains 1 and hence can conclude once again that the course utilization rate does not have an effect on the course repurchase variable.
Pair Concordant and Pair Disconcordant
As seen in the table above, there is only 50.7 % concordant pairs which is almost equals to the percentage of discordant pairs. Hence this indicates that the model is not suitable for course package repurchase and utilization.
Conclusion
In conclusion, the logistic regression shows that there is no association between the course package utilization and package repurchase probability. The high p-value shows that the model is not statistically significant. This corroborates with the evaluation of model which indicates that the model is not a good fit in explaining the relationship between course utilization rate and course repurchase package. Hence, course repurchase probability cannot be explained by course package utilization rate.
Unlimited 1 Month Package
Utilization Rate
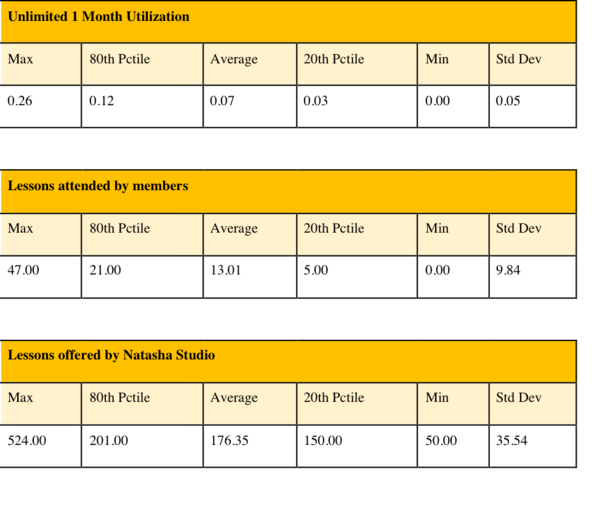
After obtaining the utilization rate, the utilization rate analysis is shown in table above. The table shows that the average course utilization rate is 7%, which is very low compared to the utilization rates of open class and courses. Moreover the maximum is at 26%, much lower than the maximum of open class and course utilization of 100%. The significantly lower utilization rate is because of the much higher number of lessons offered by Natasha Studio in 1 month compared to the number of lessons attended by members. For instance, the average number of lessons offered by Natasha Studio is 176, while members only attend 13 lessons on average per month.
Logistic Regression
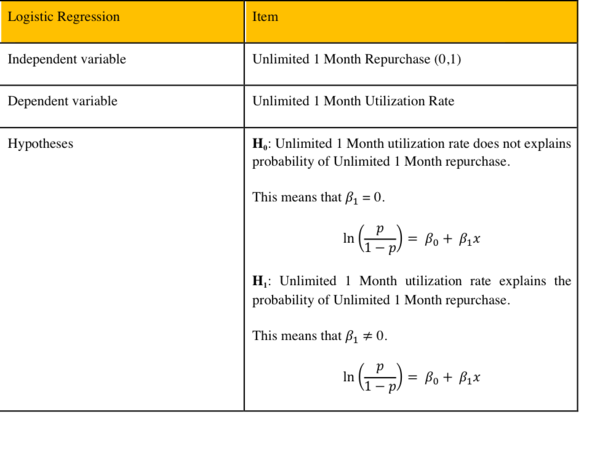
Next, logistic regression is performed to examine if the unlimited 1 month package utilization rate explains the probability of unlimited 1 month package repurchase. The table below lists the variables involved in the logistics regression model and its hypotheses. The setting of SAS EG is also adjusted where the probability output is modelled for “Repurchase = 1”.
Results
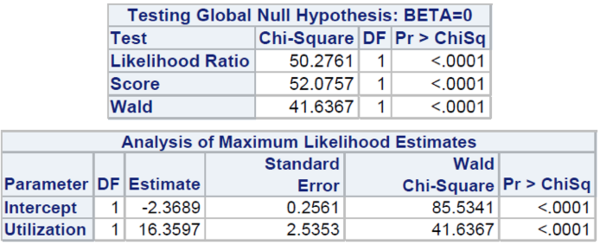
The logistic regression result obtained from SAS EG is shown in Table 52. Firstly, looking at the test for global null hypothesis, the highest p-value is less than 0.001. Using a significance level of 5%, the p-value is less than the significance level and hence null hypothesis is rejected. We conclude that unlimited 1 month utilization rate does explain the probability of course repurchase and beta-1 does not equal to 0.
This gives us the equation above, which shows that for a 1% increase in utilization rate, we see a 17% increase in odds of repurchasing the open class package.
Evaluating fit of model
Next, the fit of the logistic regression model is evaluated to confirm that the model is a good fit for the above equation.
Area under ROC Curve
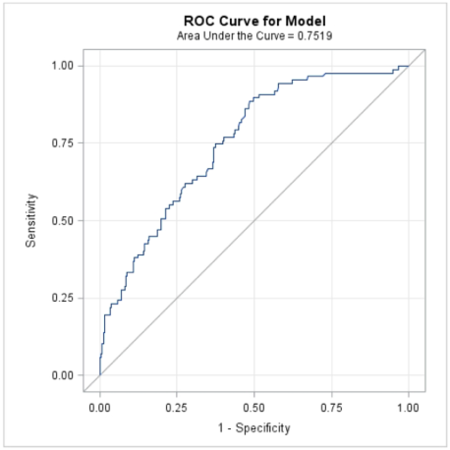
The area under ROC curve is 0.7519 as shown in the figure above, which is more than the criteria of 0.7. Hence, this indicate that the fit of the model is good.
Odds Ratio Estimate
As we see in the table above, the odds ratio 95% confidence interval does not contain 1 and hence we can conclude that the unlimited 1 month package utilization rate has an effect on the unlimited 1 month repurchase variable.
Pair Concordant and Pair Disconcordant
The model has a 75.2% concordant pairs as seen in the table above, which is a high percentage. This once again indicates that the fit of model is good.
Predicted Probability
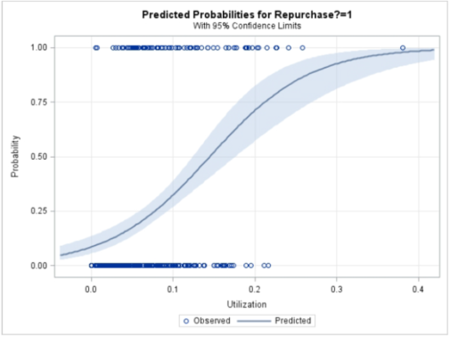
Looking at the predicted probability for Unlimited 1 Month Package as shown in Figure 38, it is observed that the probability of repurchasing the unlimited 1 month package increases as the utilization of the package increases. This indicates that there is a positive relationship between unlimited utilization rate and repurchase probability.
Limitations
| Limitations | Reason | Impact |
|---|---|---|
| Members who bought both course and unlimited 1 month packages, and open classes and unlimited 1 month packages are excluded from the model. | The ability to accurately track package utilization is affected if package overlaps, as it would create inflate the total number of lessons purchased by the members. | This reduced the member sample size included in the model. |
| Members whose packages “date start” and “date end” are missing are excluded. | This is due to the inconsistent data-recording methods in the hardcopy records. To ensure standardized analysis, members with missing observations in these two columns are excluded from the analysis. | This results in abnormally high utilization rates for some members, as their total number of lessons purchased might not be accounted for. This is mitigated by removing members with utilization rates more than 100%. |
| Classes held at the same time are included in total class purchased by member, even though it is not possible for a person to attend more than 1 lesson at the same time. | This is due to the inconsistent data-recording methods, which resulted in missing timing data for some lessons. As such, lessons cannot be accurately ascertained if they are held at the same time. | It was confirmed with Natasha Studio that there are low occurrence of classes held at the same time. Hence, even though this inflates the total number of lessons purchased by members, it is unlikely to affect utilization rate significantly. |
| Purchase data affected by the size of attendance data | The analysis require the purchase and attendance data to be aligned in terms of time period to accurately calculate utilization rate. | As attendance data is shorter in terms of time period, purchase data has been scoped accordingly, which reduces the member sample size included in the model. |
Business Recommendations
The significant finding from conducting logistic regression on all three package types offered by Natasha Studio reveals that an increase in unlimited 1 month package utilization rate increases the odds of repurchasing the package significantly. This finding is not applicable for open class and course packages, where open class has shown a low probability of package repurchase despite full package utilization while the latter has shown that there is no association between course utilization rate and package repurchase.
The finding is especially relevant for Natasha Studio, as it has previously been shown that there is a decrease in package purchases towards the end of 2015 in Purchase data as seen in our Exploratory Data Analysis. Moreover, Unlimited 1 Month package was also shown to be the most popular package amongst members as shown in Figure 10. Therefore, this signals a great potential for Natasha Studio to improve their business performance, taking into consideration of its waning purchases.
In light of this finding, it is recommended that Natasha Studio keep track of their members’ utilization rates for the unlimited 1 month package consistently and frequently. This business action would also be greatly supported by the database solution mentioned earlier, as it would allow Natasha Studio to keep clear records of the members’ attendance and their package related information, both which are necessary to track the members’ package utilization rates. Upon identifying members with low utilization rates, Natasha Studio could take appropriate action to improve utilization rates. One possible example could be to remind members’ of their on-going packages. In addition, Natasha Studio should also identify methods that could improve the unlimited 1 month package utilization rates effectively. A suggestion would be to conduct survey amongst members to identify causes for low utilization rates, so that targeted solutions can be implemented.
