Difference between revisions of "Twitter Analytics: Documentation"
(Created page with "<div align="center" > </div> <div> {|style="background-color:#000066; border-top:3px solid #1D393D; border-bottom:3px solid #1D393D; color:#000000 padding: 5px 0 0 0;" width=...") |
|||
| (7 intermediate revisions by the same user not shown) | |||
| Line 1: | Line 1: | ||
| + | __NOEDITSECTION__ | ||
| + | __NOTOC__ | ||
| + | |||
<div align="center" > | <div align="center" > | ||
| Line 4: | Line 7: | ||
<div> | <div> | ||
{|style="background-color:#000066; border-top:3px solid #1D393D; border-bottom:3px solid #1D393D; color:#000000 padding: 5px 0 0 0;" width="100%" cellspacing="0" cellpadding="0" valign="top" border="0" | | {|style="background-color:#000066; border-top:3px solid #1D393D; border-bottom:3px solid #1D393D; color:#000000 padding: 5px 0 0 0;" width="100%" cellspacing="0" cellpadding="0" valign="top" border="0" | | ||
| − | | style="padding:0.4em; font-size:100%; text-align:center; background-color:#000066; font-family:Book Antiqua; " width="17%" | [[ | + | | style="padding:0.4em; font-size:100%; text-align:center; background-color:#000066; font-family:Book Antiqua; " width="17%" | [[Twitter Analytics:Home|<font color="#ffffff" size=3><b>Home</b></font>]] |
| style="background:none;" width="1%" | | | style="background:none;" width="1%" | | ||
| − | | style="padding:0.4em; font-size:100%; background-color:#000066; font-family:Book Antiqua; text-align:center; color:#E6E87D" width="17%" |[[ | + | | style="padding:0.4em; font-size:100%; background-color:#000066; font-family:Book Antiqua; text-align:center; color:#E6E87D" width="17%" |[[Twitter Analytics: Project Overview |<font color="#ffffff" size=3><b>Project Overview</b></font>]] |
| style="background:none;" width="1%" | | | style="background:none;" width="1%" | | ||
| − | | style="padding:0.4em; font-size:90%; background-color:#000066; font-family:Book Antiqua; text-align:center; color:#E6E87D" width="17%" |[[ | + | | style="padding:0.4em; font-size:90%; background-color:#000066; font-family:Book Antiqua; text-align:center; color:#E6E87D" width="17%" |[[Twitter Analytics: Project Management |<font color="#ffffff" size=3><b>Project Management</b></font>]] |
| style="background:none;" width="1%" | | | style="background:none;" width="1%" | | ||
| − | | style="padding:0.4em; font-size:100%; background-color:#333399; font-family:Book Antiqua; text-align:center; color:#E6E87D" width="17%" |[[ | + | | style="padding:0.4em; font-size:100%; background-color:#333399; font-family:Book Antiqua; text-align:center; color:#E6E87D" width="17%" |[[Twitter Analytics: Documentation|<font color="#ffffff" size=3><b>Documentation</b></font>]] |
| style="background:none;" width="1%" | | | style="background:none;" width="1%" | | ||
| − | | style="padding:0.4em; font-size:100%; background-color:#000066; font-family:Book Antiqua; text-align:center; color:#E6E87D" width="17%" |[[ | + | | style="padding:0.4em; font-size:100%; background-color:#000066; font-family:Book Antiqua; text-align:center; color:#E6E87D" width="17%" |[[Twitter Analytics: Findings|<font color="#ffffff" size=3><b>Findings</b></font>]] |
| style="background:none;" width="1%" | | | style="background:none;" width="1%" | | ||
| − | | style="padding:0.4em; font-size:100%; background-color:#000066; font-family:Book Antiqua; text-align:center; color:#E6E87D" width="17%" |[[ | + | | style="padding:0.4em; font-size:100%; background-color:#000066; font-family:Book Antiqua; text-align:center; color:#E6E87D" width="17%" |[[Twitter Analytics: About Me|<font color="#ffffff" size=3><b>About Me</b></font>]] |
| | | | ||
|} | |} | ||
</div> | </div> | ||
| + | |||
| + | {|style="width:100%" | ||
| + | |- | ||
| + | || | ||
| + | || | ||
| + | ==<div style="background: #000033; padding: 13px; font-weight: bold; text-align:center; line-height: 0.3em; text-indent: 20px;font-size:26px; font-family:Britannic Bold"><font color= #ffffff>Data</font></div>== | ||
| + | <div style="margin:20px; padding: 10px; background: #ffffff; font-family: Trebuchet MS, sans-serif; font-size: 95%;-webkit-border-radius: 15px;-webkit-box-shadow: 7px 4px 14px rgba(176, 155, 121, 0.96); -moz-box-shadow: 7px 4px 14px rgba(176, 155, 121, 0.96);box-shadow: 7px 4px 14px rgba(176, 155, 121, 0.96);"> | ||
| + | <font size =3 face=Georgia > | ||
| + | |||
| + | <p>Data is collected from Twitter with Python and stored in SQLite database. Several keywords have been tried and retrieved such as “#ippt”, “#gaza” and “#MH17”. However, the data collected is deemed to be unrepresentative as it is seasonal (“#ippt” and “MH17”) which spikes high during a short period of time. On the other hand,“#gaza” keyword retrieves a lot of tweets within a short period of time which makes a better data. However, we may need to gather more data in terms of time frame and its granularity to find the suitable forecasting.</p> | ||
| + | |||
| + | <p> Hence, the data chosen are iPhone6 tweets and Samsung tweets from 6th October 2014 12:00-00:00 | ||
| + | |||
| + | <p>Based on the processing speed limitation of R, this project will only look into 10,000 rows of data for efficiency. However, more data can be analyzed if time is not a constraint to the project. | ||
| + | From the data gathered, various attributes are collected. However, the below will be the focus of this project:</p> | ||
| + | * Id | ||
| + | * Created_at | ||
| + | * In_reply_to | ||
| + | * In_reply_to_status_id | ||
| + | * In_reply_to_user_id | ||
| + | * Iso_languange | ||
| + | * Source | ||
| + | * Text | ||
| + | * User_id | ||
| + | * User_screen_name | ||
| + | * Search_id | ||
| + | |||
| + | |||
| + | <h3> Data Cleansing Methodology </h3> | ||
| + | Upon data exploration, the following methodologies for data cleansing is proposed: | ||
| + | * Choosing English | ||
| + | * Remove all links | ||
| + | * Remove retweet entries | ||
| + | * Make each letter lowercase | ||
| + | * Remove punctuations | ||
| + | * Remove numbers | ||
| + | * Define stopwords – English library and additional words | ||
| + | * Stem document | ||
| + | * Create document term matrix | ||
| + | * Remove sparse terms that do not help to distinguish the documents | ||
| + | ** Sparse terms are defined as terms that occur only in very few documents. Normally, this reduces the matrix dramatically without losing significant relations inherent to the matrix | ||
| + | **On top of the package, further elimination is done by: | ||
| + | ** Find the sum of words in each document | ||
| + | ** Remove all docs without words | ||
| + | |||
| + | |||
| + | <h3> Data Exploration Findings </h3> | ||
| + | <p>Several findings from data exploration to find pattern:</p> | ||
| + | # “@..” can be used to identify the relationship between users and classified as one user “mentions” another user in the post | ||
| + | # “RT” can be used to indicate retweet of content by another user to indicate influencers | ||
| + | # Location is not recommended, as a selection features as users’ preference polarity exist. Some tends to disable their location tracking in their device while others may not. Hence, by separating the groups, there is a likelihood that only the same group of users are analyzed | ||
| + | |||
| + | |||
| + | </font> | ||
| + | </div> | ||
| + | |||
| + | |||
| + | ==<div style="background: #000033; padding: 13px; font-weight: bold; text-align:center; line-height: 0.3em; text-indent: 20px;font-size:26px; font-family:Britannic Bold"><font color= #ffffff>Project Approach</font></div>== | ||
| + | <div style="margin:20px; padding: 10px; background: #ffffff; font-family: Trebuchet MS, sans-serif; font-size: 95%;-webkit-border-radius: 15px;-webkit-box-shadow: 7px 4px 14px rgba(176, 155, 121, 0.96); -moz-box-shadow: 7px 4px 14px rgba(176, 155, 121, 0.96);box-shadow: 7px 4px 14px rgba(176, 155, 121, 0.96);"> | ||
| + | <font size =3 face=Georgia > | ||
| + | |||
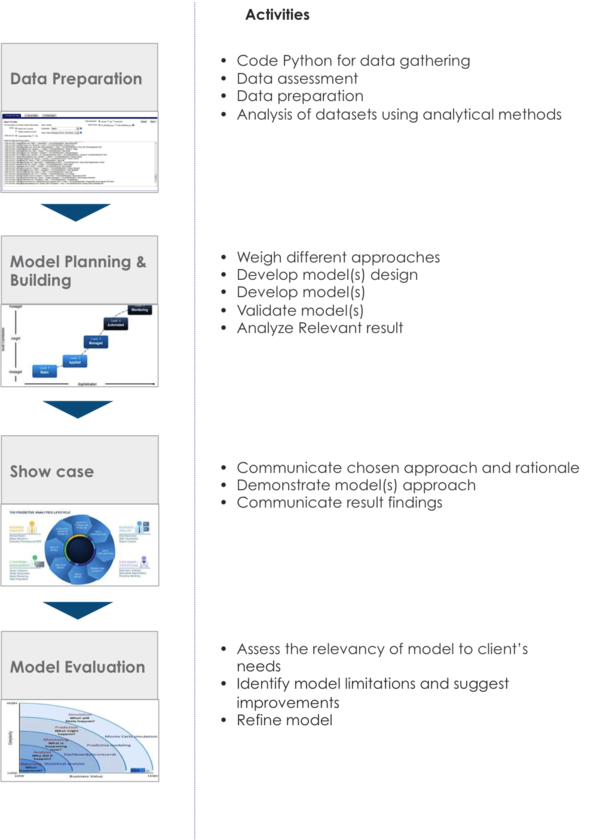
| + | <p>The analytics project delivery and development utilizes the agile and iterative implementation approach. Hence, frequent communication with clients and teaching staff to gather inputs for model development and refinement will be emphasized in various stages </p> | ||
| + | </font> | ||
| + | <div align="center"> | ||
| + | [[Image:fap6.png|600px]] | ||
| + | <br/> | ||
| + | </div> | ||
| + | </div> | ||
| + | |||
| + | ==<div style="background: #000033; padding: 13px; font-weight: bold; text-align:center; line-height: 0.3em; text-indent: 20px;font-size:26px; font-family:Britannic Bold"><font color= #ffffff>Forecasting Approach</font></div>== | ||
| + | <div style="margin:20px; padding: 10px; background: #ffffff; font-family: Trebuchet MS, sans-serif; font-size: 95%;-webkit-border-radius: 15px;-webkit-box-shadow: 7px 4px 14px rgba(176, 155, 121, 0.96); -moz-box-shadow: 7px 4px 14px rgba(176, 155, 121, 0.96);box-shadow: 7px 4px 14px rgba(176, 155, 121, 0.96);"> | ||
| + | |||
| + | <div align="center"> | ||
| + | [[Image:fap7.png|600px]] | ||
| + | </div> | ||
| + | <font size =3 face=Georgia > | ||
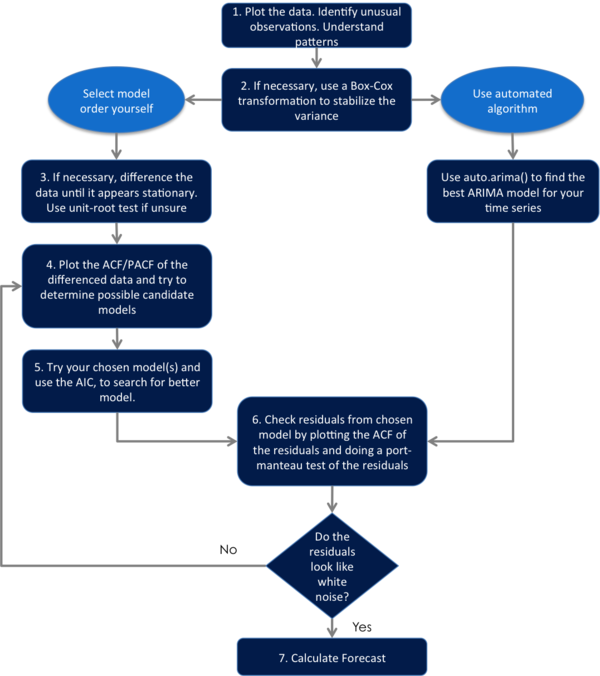
| + | <p>Adapted from: [http://www.analyticbridge.com/profiles/blogs/time-series-analysis-using-%20r-forecast-package http://www.analyticbridge.com/profiles/blogs/time-series-analysis-using- r-forecast-package]</p> | ||
| + | </font> | ||
| + | |||
| + | </div> | ||
| + | |||
| + | |||
| + | ==<div style="background: #000033; padding: 13px; font-weight: bold; text-align:center; line-height: 0.3em; text-indent: 20px;font-size:26px; font-family:Britannic Bold"><font color= #ffffff>Sentiment Analysis Approach</font></div>== | ||
| + | <div style="margin:20px; padding: 10px; background: #ffffff; font-family: Trebuchet MS, sans-serif; font-size: 95%;-webkit-border-radius: 15px;-webkit-box-shadow: 7px 4px 14px rgba(176, 155, 121, 0.96); -moz-box-shadow: 7px 4px 14px rgba(176, 155, 121, 0.96);box-shadow: 7px 4px 14px rgba(176, 155, 121, 0.96);"> | ||
| + | <font size =3 face=Georgia > | ||
| + | <div align="center"> | ||
| + | [[Image:fap8.png|400px]] | ||
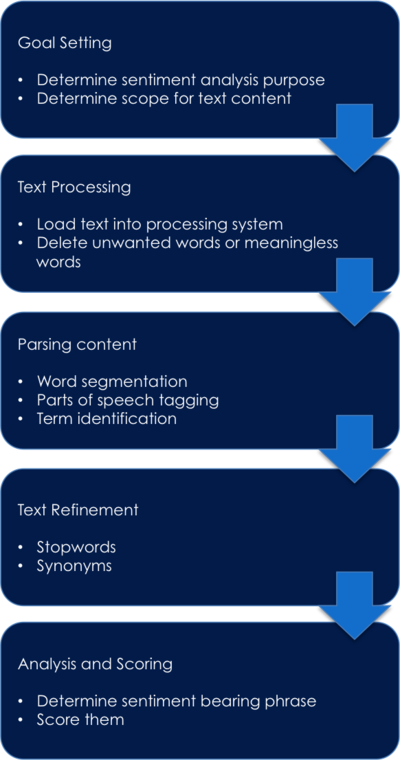
| + | <p>Adapted from: [http://sivaanalytics.wordpress.com/2013/10/10/sentiment-analysis-on-%20twitter-data-using-r-part-i/ http://sivaanalytics.wordpress.com/2013/10/10/sentiment-analysis-on- twitter-data-using-r-part-i/]</p> | ||
| + | |||
| + | </div> | ||
| + | |} | ||
| + | |||
| + | ==<div style="background: #000033; padding: 13px; font-weight: bold; text-align:center; line-height: 0.3em; text-indent: 20px;font-size:26px; font-family:Britannic Bold"><font color= #ffffff>Tools</font></div>== | ||
| + | <div style="margin:20px; padding: 10px; background: #ffffff; font-family: Trebuchet MS, sans-serif; font-size: 95%;-webkit-border-radius: 15px;-webkit-box-shadow: 7px 4px 14px rgba(176, 155, 121, 0.96); -moz-box-shadow: 7px 4px 14px rgba(176, 155, 121, 0.96);box-shadow: 7px 4px 14px rgba(176, 155, 121, 0.96);"> | ||
| + | <font size =3 face=Georgia > | ||
| + | |||
| + | <h3> Python </h3> | ||
| + | <p>Python is a widely used high-programming language that emphasize on code readability and scalability. It syntax allows programmers to code in fewer lines of code as compared to C. Python is also much better for text mining/ web scraping/ file manipulation/ XML. Features in Python such as generators is able to make processing large number of flies an ease as compared to others</p> | ||
| + | |||
| + | <h3>SQLite </h3> | ||
| + | <p>SQLite is a free in-process library that implements a portable and no server solution as it writes directly to common media. It works well with R and Python and scalable enough for the needs of the project and client’s needs as compared to utilizing a common csv file. Moreover, data security can be monitored easily as compared to cloud solution.</p> | ||
| + | |||
| + | <h3>R </h3> | ||
| + | R is an open source programming language that is developed by practicing statisticians and researchers for statistical analysis. R is also compatible with other tools such as SAS, SPSS, Oracle, SQLite, etc. There are available packages that meet the client’s requirement such as sentiment analysis and time series forecasting. | ||
| + | |||
| + | <h3>NodeXL </h3> | ||
| + | <p>NodeXL is an extendible toolkit for network overview and exploration, which can be implemented as an add-in feature in Microsoft Excel spreadsheet software. NodeXL is able to combine analysis and visualization functions with familiar spreadsheet layout for data handling. NodeXL is explored to get a better understanding of available open source tool in the market for Social Network Analysis</p> | ||
Latest revision as of 15:14, 12 October 2014
|
Tools
Python
Python is a widely used high-programming language that emphasize on code readability and scalability. It syntax allows programmers to code in fewer lines of code as compared to C. Python is also much better for text mining/ web scraping/ file manipulation/ XML. Features in Python such as generators is able to make processing large number of flies an ease as compared to others
SQLite
SQLite is a free in-process library that implements a portable and no server solution as it writes directly to common media. It works well with R and Python and scalable enough for the needs of the project and client’s needs as compared to utilizing a common csv file. Moreover, data security can be monitored easily as compared to cloud solution.
R
R is an open source programming language that is developed by practicing statisticians and researchers for statistical analysis. R is also compatible with other tools such as SAS, SPSS, Oracle, SQLite, etc. There are available packages that meet the client’s requirement such as sentiment analysis and time series forecasting.
NodeXL
NodeXL is an extendible toolkit for network overview and exploration, which can be implemented as an add-in feature in Microsoft Excel spreadsheet software. NodeXL is able to combine analysis and visualization functions with familiar spreadsheet layout for data handling. NodeXL is explored to get a better understanding of available open source tool in the market for Social Network Analysis


