Difference between revisions of "G7 Confirmatory Analysis"
| (5 intermediate revisions by the same user not shown) | |||
| Line 9: | Line 9: | ||
| style="padding:0.3em; font-size:100%; background-color:#212121; border-bottom:0px solid #3D9DD7; text-align:center; color:#F5F5F5" width="10%" | | | style="padding:0.3em; font-size:100%; background-color:#212121; border-bottom:0px solid #3D9DD7; text-align:center; color:#F5F5F5" width="10%" | | ||
| − | [[ | + | [[G7 Project Overview | <font color="#00C6BB" size=2><font face= "Century Gothic"><b>PROJECT OVERVIEW</b></font>]] |
| style="border-bottom:0px solid #3D9DD7; background:none;" width="1%" | | | style="border-bottom:0px solid #3D9DD7; background:none;" width="1%" | | ||
| style="padding:0.3em; font-size:100%; background-color:#212121; border-bottom:0px solid #3D9DD7; text-align:center; color:#F5F5F5" width="12%" | | | style="padding:0.3em; font-size:100%; background-color:#212121; border-bottom:0px solid #3D9DD7; text-align:center; color:#F5F5F5" width="12%" | | ||
| − | [[ | + | [[G7 Findings |<font color="#6FEBAO" size=2><font face= "Century Gothic"><b>ANALYSIS & FINDINGS</b></font>]] |
| style="border-bottom:0px solid #3D9DD7; background:none;" width="1%" | | | style="border-bottom:0px solid #3D9DD7; background:none;" width="1%" | | ||
| style="padding:0.3em; font-size:100%; background-color:#212121; border-bottom:0px solid #3D9DD7; text-align:center; color:#F5F5F5" width="12%" | | | style="padding:0.3em; font-size:100%; background-color:#212121; border-bottom:0px solid #3D9DD7; text-align:center; color:#F5F5F5" width="12%" | | ||
| − | [[ | + | [[G7 Project Management|<font color="#00C6BB" size=2><font face= "Century Gothic"><b>PROJECT MANAGEMENT</b></font>]] |
| style="border-bottom:0px solid #3D9DD7; background:none;" width="1%" | | | style="border-bottom:0px solid #3D9DD7; background:none;" width="1%" | | ||
| style="padding:0.3em; font-size:100%; background-color:#212121; border-bottom:0px solid #3D9DD7; text-align:center; color:#F5F5F5" width="10%" | | | style="padding:0.3em; font-size:100%; background-color:#212121; border-bottom:0px solid #3D9DD7; text-align:center; color:#F5F5F5" width="10%" | | ||
| − | [[ | + | [[G7 About Us |<font color="#00C6BB" size=2><font face= "Century Gothic"><b>ABOUT US</b></font>]] |
| style="border-bottom:0px solid #3D9DD7; background:none;" width="1%" | | | style="border-bottom:0px solid #3D9DD7; background:none;" width="1%" | | ||
| Line 36: | Line 36: | ||
{| style="background-color:white; color:white padding: 5px 0 0 0;" width="100%" height=50px cellspacing="0" cellpadding="0" valign="top" border="0" | | {| style="background-color:white; color:white padding: 5px 0 0 0;" width="100%" height=50px cellspacing="0" cellpadding="0" valign="top" border="0" | | ||
| − | | style="vertical-align:top;width:15%;" | <div style="padding: 3px; font-weight: bold; text-align:center; line-height: wrap_content; font-size:16px; font-family:helvetica"> [[ | + | | style="vertical-align:top;width:15%;" | <div style="padding: 3px; font-weight: bold; text-align:center; line-height: wrap_content; font-size:16px; font-family:helvetica"> [[G7 Findings| <b><font color="#212121">Data Cleaning</font></b>]] |
| − | | style="vertical-align:top;width:15%;" | <div style="padding: 3px; font-weight: bold; text-align:center; line-height: wrap_content; font-size:16px; font-family:helvetica"> [[ | + | | style="vertical-align:top;width:15%;" | <div style="padding: 3px; font-weight: bold; text-align:center; line-height: wrap_content; font-size:16px; font-family:helvetica"> [[G7 Exploratory Analysis| <b><font color="#212121">Exploratory Analysis</font></b>]] |
| − | | style="vertical-align:top;width:15%;" | <div style="padding: 3px; font-weight: bold; text-align:center; line-height: wrap_content; font-size:16px; border-bottom:1px solid #3D9DD7; font-family:helvetica"> [[ | + | | style="vertical-align:top;width:15%;" | <div style="padding: 3px; font-weight: bold; text-align:center; line-height: wrap_content; font-size:16px; border-bottom:1px solid #3D9DD7; font-family:helvetica"> [[G7 Confirmatory Analysis | <b><font color="#212121">Confirmatory Analysis</font></b>]] |
| − | | style="vertical-align:top;width:15%;" | <div style="padding: 3px; font-weight: bold; text-align:center; line-height: wrap_content; font-size:16px; font-family:helvetica"> [[ | + | | style="vertical-align:top;width:15%;" | <div style="padding: 3px; font-weight: bold; text-align:center; line-height: wrap_content; font-size:16px; font-family:helvetica"> [[G7 Dashboard| <b><font color="#212121">Final Dashboard</font></b>]] |
|} | |} | ||
<!--Sub Header End--> | <!--Sub Header End--> | ||
| − | |||
<font color = "#ED515C" face= "Century Gothic" size=16px> | <font color = "#ED515C" face= "Century Gothic" size=16px> | ||
| − | + | Operational Performance/BUs | |
</font> | </font> | ||
<br> | <br> | ||
| − | |||
<font color="#212121" face= "Franklin Gothic Book" size=4px> | <font color="#212121" face= "Franklin Gothic Book" size=4px> | ||
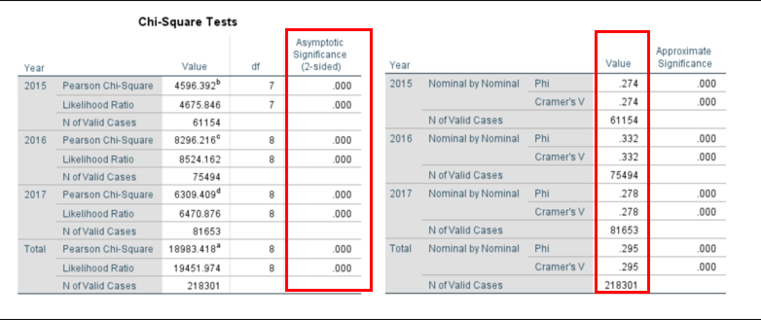
| − | + | First, we wanted to determine if the difference between operational performance across different BUs as observed in our Exploratory Analysis was statistically significant or not. Since the performance is measured by Shipment Status which is a binary variable (1 if Delayed, 0 Otherwise) and independent variable is a categorical nominal variable, we will use Chi-square test to determine the relationship between the 2 variables. The table below shows that the p-value is less than 0.01. Therefore, we can conclude that at 99% confidence level, there is a statistically significant relationship between Shipment Status and Business Units for all three years in our data set. | |
| + | |||
| + | We also conducted a Phi & Cramer’s V which measures the strength of the association between the two variables. The statistic of about 0.29 suggests a strong relationship. | ||
| + | </font> | ||
| + | [[Image:DHL_CABU.PNG|center|1300x320px]] | ||
| + | <font color="#212121" face= "Franklin Gothic Book" size=4px> | ||
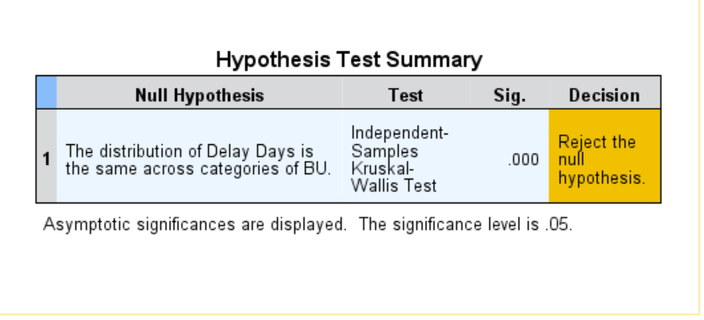
| + | We also wanted to test if the distribution of delay days is different for different Business units which can help us identify if certain Business units are delayed by more number of days compared to others or not. We cannot use parametric tests for Delay Days, so we use a non-parametric test to compare the distribution of delay days across different BUs. Since our independent variable is a categorical nominal variable with more than 2 categories, so we use K-Independent Samples Kruskal-Wallis Test. | ||
| + | </font> | ||
| + | [[Image:DHL_CABU2.png|center|1300x320px]] | ||
| + | <font color="#212121" face= "Franklin Gothic Book" size=4px> | ||
| + | As can be seen above, the Null Hypothesis was rejected as the p-value is less than 0.01, which allows the team to conclude at 99% confidence level, the distribution of delay days is not the same across different BUs. | ||
| + | </font> | ||
| + | <br> | ||
| + | <font color = "#ED515C" face= "Century Gothic" size=16px> | ||
| + | Operational Performance/Flight Types | ||
| + | |||
| + | </font> | ||
| + | <font color="#212121" face= "Franklin Gothic Book" size=4px> | ||
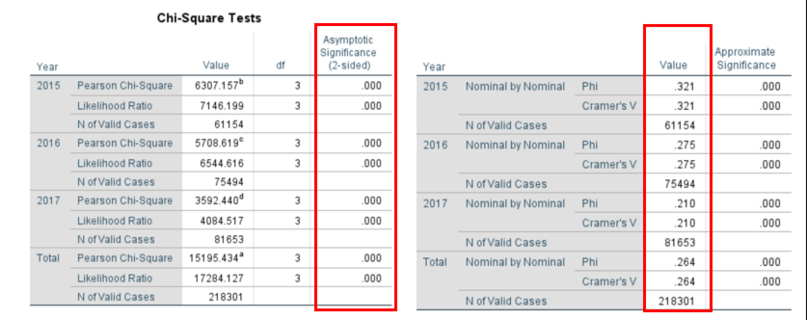
| + | We wanted to determine if the difference between operational performance for different Flight type as observed in section 6.4 was statistically significant or not. Since the performance is measured by Shipment Status which is a binary variable (1 if Delayed, 0 Otherwise) and independent variable is a categorical nominal variable, we will use Chi-square test to determine the relationship between the 2 variables. The table below shows that the p-value is less than 0.01. Therefore, we can conclude that at 99% confidence level, there is a statistically significant relationship between Shipment Status and Flight Type for all three years in our data set. | ||
| + | |||
| + | We also conducted a Phi & Cramer’s V which measures the strength of the association between the two variables. The statistic of about 0.26 suggests a moderately strong relationship. | ||
| + | </font> | ||
| + | [[Image:DHL_CAFT.PNG|center|1300x320px]] | ||
| + | |||
| + | <font color="#212121" face= "Franklin Gothic Book" size=4px> | ||
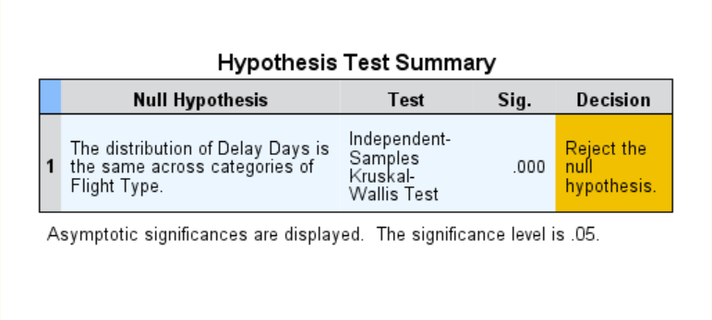
| + | Similar to the analysis for different Business Units, we wanted to test if the distribution of delay days is different for different Flight Types which can help us identify if certain Flight type is delayed by more number of days compared to others or not. Again, we use K-Independent Samples Kruskal-Wallis Test. | ||
| + | </font> | ||
| + | [[Image:DHL_CAFT2.png|center|1300x320px]] | ||
| + | <font color="#212121" face= "Franklin Gothic Book" size=4px> | ||
| + | As seen from the results obtained, the Null Hypothesis was rejected as the p-value is less than 0.01, which allows the team to conclude at 99% confidence level the distribution of delay days is not the same across different flight types. However, our Flight type also contained the category ‘OTHERS’ which can cause the test to show statistically significant results even if there is no difference between just cargo and passenger flight types. Thus, we decided to conduct a 2 independent samples test (Mann-Whitney) across Passenger and Cargo flight types. The results of which are shown below: | ||
| + | </font> | ||
| + | [[Image:DHL_CAFT3.PNG|center]] | ||
| + | <font color="#212121" face= "Franklin Gothic Book" size=4px> | ||
| + | Since the p-value is less than 0.01, the test results show at 99% confidence level, the distribution of delay days is different for Cargo and Passenger flight types. | ||
</font> | </font> | ||
Latest revision as of 18:12, 15 April 2018
Operational Performance/BUs
First, we wanted to determine if the difference between operational performance across different BUs as observed in our Exploratory Analysis was statistically significant or not. Since the performance is measured by Shipment Status which is a binary variable (1 if Delayed, 0 Otherwise) and independent variable is a categorical nominal variable, we will use Chi-square test to determine the relationship between the 2 variables. The table below shows that the p-value is less than 0.01. Therefore, we can conclude that at 99% confidence level, there is a statistically significant relationship between Shipment Status and Business Units for all three years in our data set.
We also conducted a Phi & Cramer’s V which measures the strength of the association between the two variables. The statistic of about 0.29 suggests a strong relationship.
We also wanted to test if the distribution of delay days is different for different Business units which can help us identify if certain Business units are delayed by more number of days compared to others or not. We cannot use parametric tests for Delay Days, so we use a non-parametric test to compare the distribution of delay days across different BUs. Since our independent variable is a categorical nominal variable with more than 2 categories, so we use K-Independent Samples Kruskal-Wallis Test.
As can be seen above, the Null Hypothesis was rejected as the p-value is less than 0.01, which allows the team to conclude at 99% confidence level, the distribution of delay days is not the same across different BUs.
Operational Performance/Flight Types
We wanted to determine if the difference between operational performance for different Flight type as observed in section 6.4 was statistically significant or not. Since the performance is measured by Shipment Status which is a binary variable (1 if Delayed, 0 Otherwise) and independent variable is a categorical nominal variable, we will use Chi-square test to determine the relationship between the 2 variables. The table below shows that the p-value is less than 0.01. Therefore, we can conclude that at 99% confidence level, there is a statistically significant relationship between Shipment Status and Flight Type for all three years in our data set.
We also conducted a Phi & Cramer’s V which measures the strength of the association between the two variables. The statistic of about 0.26 suggests a moderately strong relationship.
Similar to the analysis for different Business Units, we wanted to test if the distribution of delay days is different for different Flight Types which can help us identify if certain Flight type is delayed by more number of days compared to others or not. Again, we use K-Independent Samples Kruskal-Wallis Test.
As seen from the results obtained, the Null Hypothesis was rejected as the p-value is less than 0.01, which allows the team to conclude at 99% confidence level the distribution of delay days is not the same across different flight types. However, our Flight type also contained the category ‘OTHERS’ which can cause the test to show statistically significant results even if there is no difference between just cargo and passenger flight types. Thus, we decided to conduct a 2 independent samples test (Mann-Whitney) across Passenger and Cargo flight types. The results of which are shown below:
Since the p-value is less than 0.01, the test results show at 99% confidence level, the distribution of delay days is different for Cargo and Passenger flight types.


