Difference between revisions of "ANLY482 AY2017-18T2 Group14 Interim"
Mq.wang.2014 (talk | contribs) |
Mq.wang.2014 (talk | contribs) (→ODD) |
||
| (41 intermediate revisions by 2 users not shown) | |||
| Line 59: | Line 59: | ||
We do column summary (e.g. one way frequency) for each field and record the data format. Then we consolidate all information to build data definition files for each data set. | We do column summary (e.g. one way frequency) for each field and record the data format. Then we consolidate all information to build data definition files for each data set. | ||
| + | [[Image: ANLY482AY2017-18T2Group14owf1.png|400px|center]] | ||
| + | |||
</font> | </font> | ||
<br> | <br> | ||
<div style="background: #EAEAEA; padding: 10px; font-weight: bold; text-align:center; line-height: wrap_content; text-indent: 20px;font-size:20px; font-family:helvetica"><font color= #3d3d3d>Data Preparation</font></div><br> | <div style="background: #EAEAEA; padding: 10px; font-weight: bold; text-align:center; line-height: wrap_content; text-indent: 20px;font-size:20px; font-family:helvetica"><font color= #3d3d3d>Data Preparation</font></div><br> | ||
| − | <div style="background: #EAEAEA; line-height: 0.3em; border-left: #000000 solid 8px;"><div style="border-left: #FFFFFF solid 5px; padding:15px;"><font face ="Open Sans" color= "black" size="4"><b>Unify ODD Data | + | <div style="background: #EAEAEA; line-height: 0.3em; border-left: #000000 solid 8px;"><div style="border-left: #FFFFFF solid 5px; padding:15px;"><font face ="Open Sans" color= "black" size="4"><b>Unify ODD Data Format</b></font></div></div> |
| + | <font face ="Open Sans" size="4"> | ||
| + | There are 2 separate data format present in the provided ODD Data. | ||
| + | [[Image: ANLY482AY2017-18T2Group14unifydataformat1.png|600px|center]] | ||
| + | <div style="text-align: center;"> | ||
| + | Fig. 1 </div><br /> | ||
| + | <br> | ||
| + | |||
| + | Our client explained that the difference in formatting was due to the update of the database system. It started to record more variables after 9th of September in 2016. | ||
| + | <br> | ||
| + | Although Format 2 is just an extension of Format 1, and the client has clarified with us to use Format 2 as a base for the data fields. The team has encountered a mismatch between column “Account Used” in Format 1 and “ShipperAccount” in Format 2 which contain the same information. | ||
| + | <br> | ||
| + | In our cleaning of the ODD Data before inserting into the database, this mismatch must be handled and taken into consideration. Because this data files are scattered across different files, the team consolidated the various data files into 1 or 2 main files to be used for importing into the database. | ||
| + | <br> | ||
| + | Because of the 2 formats used, our first step is to consolidate data rows across a single format into a single file. This can be done using JMP’s Concatenate function, which combine rows across different sources. | ||
| + | <br> | ||
| + | In the Format 1 Consolidated file, the combined data was cleaned and have columns names (Account used → ShipperAccount) renamed in order to match with Format 2. | ||
| + | [[Image:ANLY482AY2017-18T2Group14Consolidate.png|600px|center]] | ||
| + | <div style="text-align: center;"> | ||
| + | Fig. 2 </div><br /> | ||
| + | |||
| + | Then lastly, we combined the consolidation above with the remainder of the ODD data files that uses Format 2 into 1 single and final file. | ||
| + | <br> | ||
| + | However, we have to split the data into 2 smaller files by year as the final file was getting too huge and had problems being opened. | ||
| + | |||
| + | [[Image:ANLY482AY2017-18T2Group142smallerfiles.png|600px|center]] | ||
| + | <div style="text-align: center;"> | ||
| + | Fig. 3 </div><br /> | ||
| + | |||
| + | Also, since there is no clear date time columns that separate the rows in the ODD data into the different months in the file. The team has decided to add in a new column “RecordMonth” (Format: YYYYMM) to help us better identify the Month-Year/Data File which the record originated from. | ||
| + | |||
| + | </font> | ||
| + | <div style="background: #EAEAEA; line-height: 0.3em; border-left: #000000 solid 8px;"><div style="border-left: #FFFFFF solid 5px; padding:15px;"><font face ="Open Sans" color= "black" size="4"><b>Database Construction</b></font></div></div> | ||
| + | <font face ="Open Sans" size="4"> | ||
| + | Part of the requirements of this project is to set up a database to store the data that will be used for the required visualisation report. | ||
| + | |||
| + | In consideration of possible data integration problems with their existing database solution, the team has decided to use Microsoft SQL Server (MSSQL), which is also their existing database solution, to create the database and to store the data in. | ||
| + | |||
| + | For data table creation, we made use of the Data Import and Export Wizard Tool in MSSQL to import the data from various different files into the database. Upon selection of the data source (which supports Flat File, Excel, Access Database) and the data destination. MSSQL will read the source file and map out recommended field types based on the created field data types in the destination table or a recommended data type by MSSQL if the destination table has not been created. | ||
| + | |||
| + | [[Image:ANLY482AY2017-18T2Group14DB1.png|600px|center]] | ||
| + | <div style="text-align: center;"> | ||
| + | Fig. 1 </div><br /> | ||
| + | |||
| + | ===OPMS=== | ||
| + | |||
| + | The OPMS Dataset was handover over to us in terms of smaller files, each file containing 1 month of data. As OPMS data was pulled from their existing centralised system, the data in between the various files tally with one another. Therefore, no further cleaning of OPMS data was done before importing to the database. | ||
| + | <br> | ||
| + | Due to the fact that OPMS data has 180 columns, we have decided to determine the field types and size before creating the table. | ||
| + | Certain columns of information also have been identified to be much more critical for us to extract information, such as columns awb_no, start_clock_day_, shacct_no. | ||
| + | <br> | ||
| + | As such we have created indexes beforehand to enhance our data searching and extracting from the database after data importation. | ||
| + | <br> | ||
| + | After importing the OPMS data, the final data table of OPMS has 80 million rows, taking up 22 GB of space. | ||
| + | [[Image:ANLY482AY2017-18T2Group14DB2.png|500px|center]] | ||
| + | <div style="text-align: center;"> | ||
| + | Fig. 2 </div><br /> | ||
| + | |||
| + | ===ODD=== | ||
| + | |||
| + | For the ODD Dataset that was cleaned, which totals up to be of 2.135 million rows, can be imported into MSSQL with relatively ease. | ||
| + | [[Image:ANLY482AY2017-18T2Group14DB3.png|500px|center]] | ||
| + | <div style="text-align: center;"> | ||
| + | Fig. 3 </div><br /> | ||
| + | The eventual ODD data table is 1.2 GB. | ||
| + | |||
| + | </font> | ||
| + | |||
| + | <br><div style="background: #EAEAEA; line-height: 0.3em; border-left: #000000 solid 8px;"><div style="border-left: #FFFFFF solid 5px; padding:15px;"><font face ="Open Sans" color= "black" size="4"><b>Data Cleaning</b></font></div></div> | ||
| + | <font face ="Open Sans" size="4"> | ||
| + | The data cleaning process includes fields selection, remove Rows with AWB equals to Null, remove duplicate data, unify column name, unify Column Values in standardized format and generate derived columns. <br> | ||
| + | <b> Due to data confidentiality, the detailed data cleaning process will only be shown in the interim report. </b> | ||
| + | </font> | ||
<br> | <br> | ||
| − | <div style="background: #EAEAEA; padding: 10px; font-weight: bold; text-align:center; line-height: wrap_content; text-indent: 20px;font-size:20px; font-family:helvetica"><font color= #3d3d3d>Data Exploration</font></div> | + | <div style="background: #EAEAEA; padding: 10px; font-weight: bold; text-align:center; line-height: wrap_content; text-indent: 20px;font-size:20px; font-family:helvetica"><font color= #3d3d3d>Data Exploration and Visualization</font></div> |
| + | <font face ="Open Sans" size="4"><b> Due to data confidentiality, we are requested to mask all actual figures for the chats below.</b> </font> | ||
| + | <br><div style="background: #EAEAEA; line-height: 0.3em; border-left: #000000 solid 8px;"><div style="border-left: #FFFFFF solid 5px; padding:15px;"><font face ="Open Sans" color= "black" size="4"><b>Visualization</b></font></div></div> | ||
| + | <font face ="Open Sans" size=4> | ||
| + | We have also provided a visualisation of Output 0 in both a Pie Chart and a Tree Map, as shown below. The visualisation comes with a hierarchical view where it can be freely drilled up and down according to the user’s wishes. | ||
| + | [[Image: ANLY482AY2017-18T2Group14EDA1.png|500px|center]] | ||
| + | <div style="text-align: center;"> | ||
| + | Fig. 1 </div><br /> | ||
| + | |||
| + | [[Image: ANLY482AY2017-18T2Group14EDA2.png|500px|center]] | ||
| + | <div style="text-align: center;"> | ||
| + | Fig. 2 </div><br /> | ||
| + | |||
| + | We have provided a visualization of Output 1 in both a Pie Chart and a stacked Bar Chart, as shown below. | ||
| + | [[Image: ANLY482AY2017-18T2Group14EDA3.png|600px|center]] | ||
| + | <div style="text-align: center;"> | ||
| + | Fig. 3 </div><br /> | ||
| + | [[Image: ANLY482AY2017-18T2Group14EDA4.png|600px|center]] | ||
| + | <div style="text-align: center;"> | ||
| + | Fig. 4 </div><br /> | ||
| + | </font> | ||
<br> | <br> | ||
<div style="background: #EAEAEA; padding: 10px; font-weight: bold; text-align:center; line-height: wrap_content; text-indent: 20px;font-size:20px; font-family:helvetica"><font color= #3d3d3d>Challenges</font></div> | <div style="background: #EAEAEA; padding: 10px; font-weight: bold; text-align:center; line-height: wrap_content; text-indent: 20px;font-size:20px; font-family:helvetica"><font color= #3d3d3d>Challenges</font></div> | ||
| Line 90: | Line 184: | ||
<br> | <br> | ||
<div style="background: #EAEAEA; padding: 10px; font-weight: bold; text-align:center; line-height: wrap_content; text-indent: 20px;font-size:20px; font-family:helvetica"><font color= #3d3d3d>Limitations</font></div> | <div style="background: #EAEAEA; padding: 10px; font-weight: bold; text-align:center; line-height: wrap_content; text-indent: 20px;font-size:20px; font-family:helvetica"><font color= #3d3d3d>Limitations</font></div> | ||
| + | <font face ="Open Sans" size=4> | ||
| + | 1. Existing excel report format is not replicable for ODD 2016 data, as some columns used to produce report are missing in 2016, such as, BU/AH, hasRDcp | ||
| + | [[Image: ANLY482AY2017-18T2Group14limitation.png|200px|center]] | ||
| + | <div style="text-align: center;"> | ||
| + | Fig. 1 </div><br /> | ||
| + | 2. The maximum data processing capacity of Power BI is 10 GB, the size of the two-year data is about 28 GB, which is much larger than the limitation. | ||
| + | </font> | ||
<br> | <br> | ||
<div style="background: #EAEAEA; padding: 10px; font-weight: bold; text-align:center; line-height: wrap_content; text-indent: 20px;font-size:20px; font-family:helvetica"><font color= #3d3d3d>Next Phase</font></div> | <div style="background: #EAEAEA; padding: 10px; font-weight: bold; text-align:center; line-height: wrap_content; text-indent: 20px;font-size:20px; font-family:helvetica"><font color= #3d3d3d>Next Phase</font></div> | ||
| Line 97: | Line 198: | ||
In the next sprint, we will be continuously working on the excel report output0 to output3. As requested by project sponsor, we will keep the origin format for the management team and at the same time, polish origin report to make it more interactive. We aim to finish this by 15 Mar 2018. | In the next sprint, we will be continuously working on the excel report output0 to output3. As requested by project sponsor, we will keep the origin format for the management team and at the same time, polish origin report to make it more interactive. We aim to finish this by 15 Mar 2018. | ||
<br><br> | <br><br> | ||
| − | Also, we will start working on insight discovery. | + | Also, we will start working on insight discovery and identifying possible Insights from the data to recommend to management. |
</font> | </font> | ||
Latest revision as of 11:45, 13 April 2018
In order to understand the structure of OPMS and ODD data sets, we acquired OPMS and ODD fields definition files from our client. However, we found several issues from the definition files provided, which are listed as following:
1. certain variables are not being defined;
2. some variables have different names;
3. all data fields have no indicated data types.
As such, we decided to load sample data of OPMS and ODD into SAS Enterprise Guide to help us understand the metadata.
We do column summary (e.g. one way frequency) for each field and record the data format. Then we consolidate all information to build data definition files for each data set.
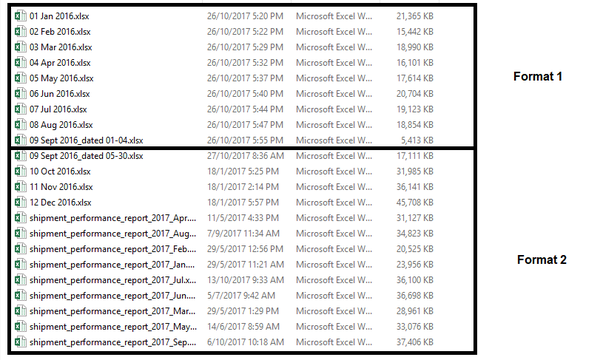
There are 2 separate data format present in the provided ODD Data.
Our client explained that the difference in formatting was due to the update of the database system. It started to record more variables after 9th of September in 2016.
Although Format 2 is just an extension of Format 1, and the client has clarified with us to use Format 2 as a base for the data fields. The team has encountered a mismatch between column “Account Used” in Format 1 and “ShipperAccount” in Format 2 which contain the same information.
In our cleaning of the ODD Data before inserting into the database, this mismatch must be handled and taken into consideration. Because this data files are scattered across different files, the team consolidated the various data files into 1 or 2 main files to be used for importing into the database.
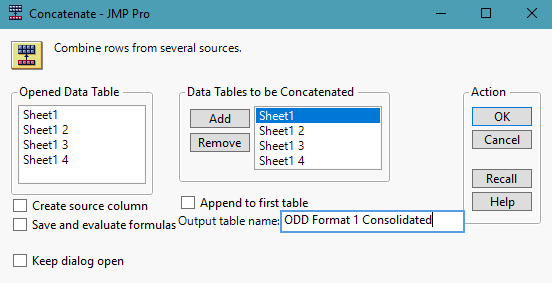
Because of the 2 formats used, our first step is to consolidate data rows across a single format into a single file. This can be done using JMP’s Concatenate function, which combine rows across different sources.
In the Format 1 Consolidated file, the combined data was cleaned and have columns names (Account used → ShipperAccount) renamed in order to match with Format 2.
Then lastly, we combined the consolidation above with the remainder of the ODD data files that uses Format 2 into 1 single and final file.
However, we have to split the data into 2 smaller files by year as the final file was getting too huge and had problems being opened.
Also, since there is no clear date time columns that separate the rows in the ODD data into the different months in the file. The team has decided to add in a new column “RecordMonth” (Format: YYYYMM) to help us better identify the Month-Year/Data File which the record originated from.
Part of the requirements of this project is to set up a database to store the data that will be used for the required visualisation report.
In consideration of possible data integration problems with their existing database solution, the team has decided to use Microsoft SQL Server (MSSQL), which is also their existing database solution, to create the database and to store the data in.
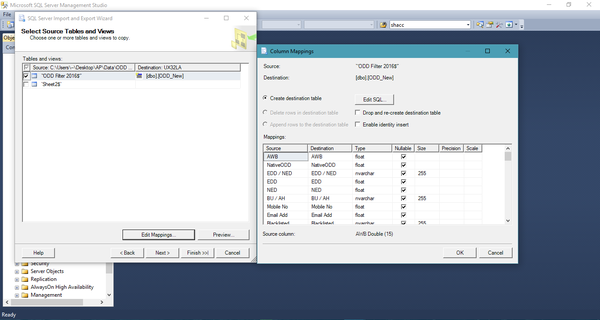
For data table creation, we made use of the Data Import and Export Wizard Tool in MSSQL to import the data from various different files into the database. Upon selection of the data source (which supports Flat File, Excel, Access Database) and the data destination. MSSQL will read the source file and map out recommended field types based on the created field data types in the destination table or a recommended data type by MSSQL if the destination table has not been created.
OPMS
The OPMS Dataset was handover over to us in terms of smaller files, each file containing 1 month of data. As OPMS data was pulled from their existing centralised system, the data in between the various files tally with one another. Therefore, no further cleaning of OPMS data was done before importing to the database.
Due to the fact that OPMS data has 180 columns, we have decided to determine the field types and size before creating the table.
Certain columns of information also have been identified to be much more critical for us to extract information, such as columns awb_no, start_clock_day_, shacct_no.
As such we have created indexes beforehand to enhance our data searching and extracting from the database after data importation.
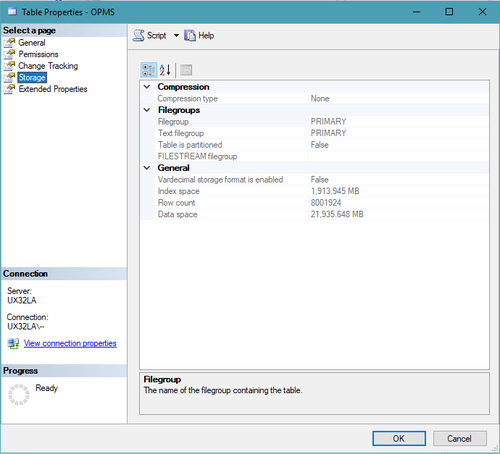
After importing the OPMS data, the final data table of OPMS has 80 million rows, taking up 22 GB of space.
ODD
For the ODD Dataset that was cleaned, which totals up to be of 2.135 million rows, can be imported into MSSQL with relatively ease.
The eventual ODD data table is 1.2 GB.
The data cleaning process includes fields selection, remove Rows with AWB equals to Null, remove duplicate data, unify column name, unify Column Values in standardized format and generate derived columns.
Due to data confidentiality, the detailed data cleaning process will only be shown in the interim report.
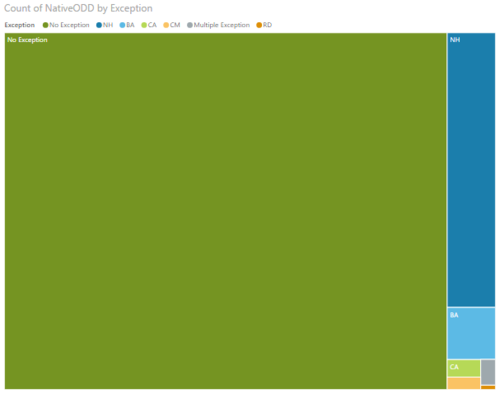
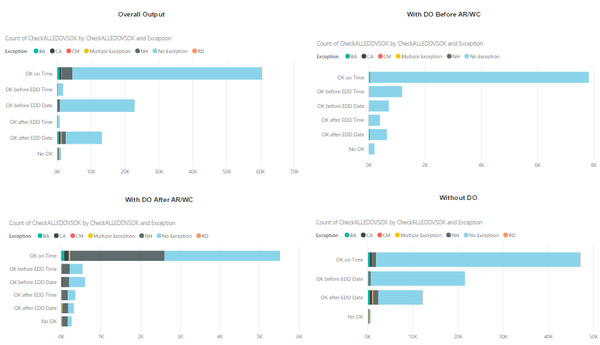
Due to data confidentiality, we are requested to mask all actual figures for the chats below.
We have also provided a visualisation of Output 0 in both a Pie Chart and a Tree Map, as shown below. The visualisation comes with a hierarchical view where it can be freely drilled up and down according to the user’s wishes.
We have provided a visualization of Output 1 in both a Pie Chart and a stacked Bar Chart, as shown below.
1. Unfamiliarity of MSSQL and Power BI:
Prior to this project, we don’t have any prior experience on these tools, Thus, at the beginning of the project, we invested plenty of time in learning and familaring these tools.
2. Lack of domain knowledge:
Domain knowledge is essential in understanding the dataset given, due to the incomplete data definition, we spent a lot of time figuring out the meaning of data, consolidating and documenting the data dictionary.
3. Communicate with users have non-IT background:
We found it is challenging to communicate with users that have limited IT background. Our project sponsor is from operation management. Thus, when we explain some technical complexity to project sponsor, we need to put it into simple and plain words.
4. Data inconsistency (inconsistent data type, data columns, data values):
Data collected from the project sponsor is stored in different places with different formats. Besides, the variable type and variable values are highly inconsistent.
1. Existing excel report format is not replicable for ODD 2016 data, as some columns used to produce report are missing in 2016, such as, BU/AH, hasRDcp
2. The maximum data processing capacity of Power BI is 10 GB, the size of the two-year data is about 28 GB, which is much larger than the limitation.
In the next sprint, we will be continuously working on the excel report output0 to output3. As requested by project sponsor, we will keep the origin format for the management team and at the same time, polish origin report to make it more interactive. We aim to finish this by 15 Mar 2018.
Also, we will start working on insight discovery and identifying possible Insights from the data to recommend to management.


