Difference between revisions of "ANLY482 AY2017-18T2 Group19 Data"
Jump to navigation
Jump to search

Loan Transaction Data
Course Reserve Books Master Data
| (8 intermediate revisions by the same user not shown) | |||
| Line 1: | Line 1: | ||
<!--Logo--> | <!--Logo--> | ||
| − | [[Image: | + | [[Image:G19_Logo.png|center|800x150px|link=ANLY482 AY2017-18T2 Group19]]<br> |
<!--Navbar Start--> | <!--Navbar Start--> | ||
| Line 41: | Line 41: | ||
| style="vertical-align:top;width:25%;" | <div style="padding: 3px; font-weight: bold; text-align:center; line-height: wrap_content; font-size:14px; border: 0px solid; font-family:helvetica"> | | style="vertical-align:top;width:25%;" | <div style="padding: 3px; font-weight: bold; text-align:center; line-height: wrap_content; font-size:14px; border: 0px solid; font-family:helvetica"> | ||
| − | [[ANLY482 AY2017-18T2 Group19 | + | [[ANLY482 AY2017-18T2 Group19 Project Overview| <font face='Century Gothic' color="#FFFFFF"><b>BACKGROUND</b></font>]] |
| style="vertical-align:top;width:25%;" | <div style="padding: 3px; font-weight: bold; text-align:center; line-height: wrap_content; font-size:14px; border: 0px solid; font-family:helvetica"> | | style="vertical-align:top;width:25%;" | <div style="padding: 3px; font-weight: bold; text-align:center; line-height: wrap_content; font-size:14px; border: 0px solid; font-family:helvetica"> | ||
| Line 53: | Line 53: | ||
| − | + | We have obtained the following datasets from the client | |
| + | # Year 2016 - 2-hour transaction data | ||
| + | # Year 2016 - 3-day transaction data | ||
| + | # Year 2017 - 3-hour transaction data | ||
| + | # Year 2017 - 3-day transaction data | ||
| + | # Course reserve books master data | ||
| − | + | Each row represents one borrowing instance. It was given to us in the following format: | |
| − | |||
| − | |||
| − | |||
| − | + | <center><i>Loan Transaction Data</i></center> | |
| − | |||
| − | |||
| − | |||
| − | |||
| − | |||
| − | + | [[Image:G19_MetaData1.png|500px|center]] | |
| − | |||
| − | |||
| − | |||
| − | |||
| − | |||
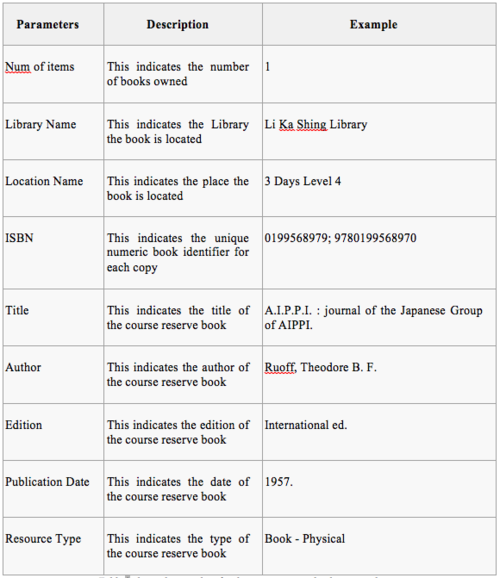
| − | The | + | The course reserve books master data details the collection of course reserves available for loan. This dataset would include the following fields of information: |
| − | |||
| − | |||
| − | |||
| − | |||
| − | |||
| + | <center><i>Course Reserve Books Master Data</i></center> | ||
| − | + | [[Image:G19_MetaData2.png|500px|center]] | |
| − | |||
| − | |||
| − | |||
| − | |||
| − | |||
| − | |||
| − | |||
| − | |||
| − | |||
| − | |||
| − | |||
| − | |||
Latest revision as of 19:36, 15 April 2018
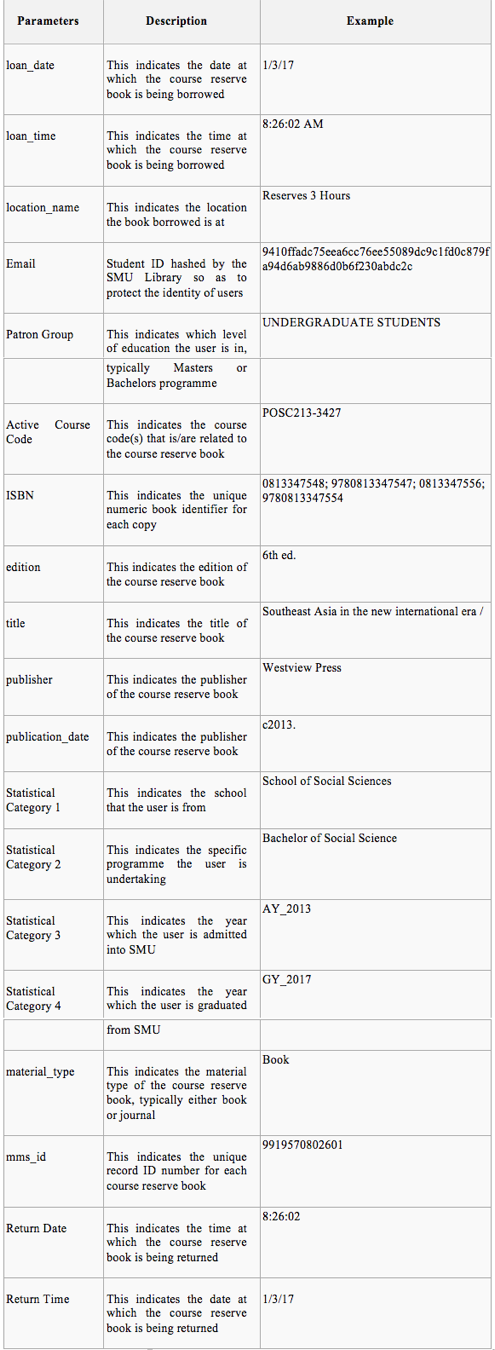
We have obtained the following datasets from the client
- Year 2016 - 2-hour transaction data
- Year 2016 - 3-day transaction data
- Year 2017 - 3-hour transaction data
- Year 2017 - 3-day transaction data
- Course reserve books master data
Each row represents one borrowing instance. It was given to us in the following format:

The course reserve books master data details the collection of course reserves available for loan. This dataset would include the following fields of information:
