Difference between revisions of "ANLY482 AY2016-17 T2 Group19 Findings"
| (18 intermediate revisions by 3 users not shown) | |||
| Line 37: | Line 37: | ||
<!--End Navigation--> | <!--End Navigation--> | ||
<!--End Header--> | <!--End Header--> | ||
| − | |||
=<div style="background: #4d4d4d; padding: 20px; line-height: 0.1em; text-indent: 10px; font-size:20px; font-family: Trajan Pro; border-radius: 7px; border-bottom:3px solid #ba3749"><font color= #ffffff>Exploratory Data Analysis</font></div>= | =<div style="background: #4d4d4d; padding: 20px; line-height: 0.1em; text-indent: 10px; font-size:20px; font-family: Trajan Pro; border-radius: 7px; border-bottom:3px solid #ba3749"><font color= #ffffff>Exploratory Data Analysis</font></div>= | ||
| − | + | The intention behind exploratory data analysis is not just to explore the data set but also to understand how Company Z's data can be grouped in a more meaniningful way in the form of visual analytics. The analysis done here would serve as material for the development of the visual dashboard. | |
<div style="margin:0px; padding: 10px; background: #f2f4f4; font-family: Arial, sans-serif; border-radius: 7px; "> | <div style="margin:0px; padding: 10px; background: #f2f4f4; font-family: Arial, sans-serif; border-radius: 7px; "> | ||
<div style="text-align: justify;"> | <div style="text-align: justify;"> | ||
| Line 95: | Line 94: | ||
<div style="text-align: justify;"> | <div style="text-align: justify;"> | ||
| + | |||
| + | This category contributed about 12% of Company Z's total revenue and it consists of three subcategories, Antiasthmatic & COPD Preparations, Cough & Cold Preparations, Nasal Decongestants & Other Nasal Preparations. The graph below shows the yearly sales trend of this category. | ||
| + | |||
| + | [[File:Respiratory Yearly.png|500px|centre]] | ||
| + | |||
| + | A monthly sales trend was also plotted as follows: | ||
| + | |||
| + | [[File:Respiratory Trends.png|500px|centre]] | ||
| + | |||
| + | There seems to be no clear seasonal trend overall, that being said, it is noted that sales for Respiratory System has been increasing overall and this is attributable to the large revenue growth in Cough & Cold Preparations as well as Nasal decongestants & Other Nasal Preparations. These two subcategories have experienced a significant increase in sales from 2015 to 2016 which also coincided with news reports about avian flu and Middle East Respiratory Syndrome (MERS). This could be indicative of GP’s anticipating larger numbers of patients with flu-like symptoms or that there was an increased amount of patients who suffered from coughs and colds in the year 2016. | ||
| + | |||
| + | Drilling down further, we can identify that the main product driving increases in cough and cold preparations is that of Zyrtec and Zyrtec-D with a distinct difference between the total sales of this category with (right image) and without (left image) including these 2 products. | ||
| + | |||
| + | [[File:Zyrtec Trends.png|600px|centre]] | ||
| + | |||
| + | We can also see that these 2 products have picked up in popularity over the past few years as seen from the chart below of the sum of sales of these products alone and this may be the result of more aggressive marketing or a greater prescription rate of these medicines. | ||
| + | |||
| + | [[File:Zyrtec Sales.png|500px|centre]] | ||
| + | |||
===Central Nervous System=== | ===Central Nervous System=== | ||
<div style="text-align: justify;"> | <div style="text-align: justify;"> | ||
| + | This category contributed about 10% of the total sales revenue with the top 3 subcategories as follows, NSAIDs (Nonsteroidal anti-inflammatory drugs, commonly known as painkillers), Anticonvulsants and Antidepressants. Anticonvulsants are used to treat epileptic seizures while antidepressants are used to treat anxiety disorders such as depression and Obsessive Compulsive Disorder. | ||
| + | |||
| + | The following graph is the yearly sales trend of the top 3 subcategories: | ||
| + | [[File:CNS Yearly.png|500px|centre]] | ||
| + | |||
| + | Followed by a monthly sales trend of those categories: | ||
| + | [[File:CNS Trends.png|500px|centre]] | ||
| + | |||
| + | Seasonal patterns are not expected since the use of such a drug is broad and can be used to suppress discomfort. Although it can be observed that they sales quantity has grown over time, it is still unknown if such an increment in suppressants is due to an increase in the lack of pain tolerance or an increase in quality treatment by relieving pain. Overall, all 3 subcategories experienced growth in sales which may be indicative of an increased prevalence of epilepsy and neurological disorders. However, the increased rate of growth in sales for Anticonvulsants may possibly be indicative of an increased rate of epilepsy in the GPs’ patients. The increased sales for Antidepressants may be attributed to a paradigm shift in anxiety disorders in especially stressful environment as according to The Straits Times. | ||
| + | |||
| + | The low sales quantity may suggest that psychological stresses are usually treated more commonly in hospitals and by specialists instead of regular GPs while NSAIDs’ application is more widely found in GP’s prescriptions. This analysis may prove to help Company Z to understand the synergy between drug uses and end consumer needs. Going forward, should quantity decrease or increase respectively, it would help company Z paint a clearer picture of end consumer needs through buying patterns of GP. | ||
| + | |||
===Allergy & Immnue System=== | ===Allergy & Immnue System=== | ||
<div style="text-align: justify;"> | <div style="text-align: justify;"> | ||
| + | This category contributed approximately 10% of the total sales and consists of two subcategories, Antihistamines & Antiallergics and Vaccines, Antisera & Immunologicals. | ||
| + | |||
| + | [[File:Allergy Trends.png|500px|centre]] | ||
| + | |||
| + | Key trends that can be observed on a MoM basis is that Vaccines, Antisera and Immunological generally spike twice a year once around May and another around August. Drilling down, we find that 3 of the key products that are driving growth in this aspect are both flu vaccines and also a Hepatitis A & B vaccine. This may be due to rising awareness of vaccination against the influenza as well as Hepatitis A & B. It is also interesting to note that this follows the period in which there were healthcare policies implementations such that Medisave could be used for flu vaccinations. The spikes also occurred during the MERS scare and the recent avian flu scares | ||
| + | |||
| + | [[File:Allergy Product.png|800px|centre]] | ||
| + | |||
| + | |||
| + | |||
| + | [[File:Allergy Product Trend.png|500px|centre]] | ||
| + | |||
===Dermatological Therapy=== | ===Dermatological Therapy=== | ||
<div style="text-align: justify;"> | <div style="text-align: justify;"> | ||
| + | |||
| + | The next category for analysis is Dermatological Therapy which has several subcategories. The majority of its sales comes from ‘Other Dermatologicals’ of which a drug called Propecia forms 75.42% of that subcategory’s total sales. Propecia is commonly used for treating male pattern hair loss. The next highest contributor comes from Acne Treatment Preparations followed by Topical Corticosteroids which are used for treating rashes and eczema. The following graph is a yearly sales trend of the subcategories: | ||
| + | |||
| + | [[File:Skin Yearly.png|500px|centre]] | ||
| + | |||
| + | A monthly sales trend was also plotted as follows: | ||
| + | |||
| + | [[File:Skin Trend.png|500px|centre]] | ||
| + | |||
| + | As Acne Treatment Preparations and Topical corticosteroids provides solutions to persistent problems, there is a rather stable trend throughout the months. It is noteworthy to mention that both subclasses saw an increase in sales quantity from 2014 to 2016. | ||
| + | |||
| + | Sales for all 3 subcategories peaked during 2015 before decreasing in 2016, especially for Other Dermatologicals which saw sales drop past its 2014 levels. These decreases in sales could possibly be the result of a small number patients choosing to visit specialist clinics for their dermatological illnesses instead of GPs. While it also shows Propecia’s worsening performance, it is unlikely that it is due to loss of users but instead relates to the prescription methodology. A minimum of 3 months with daily intake is required to see results, while a withdrawal from treatment would see reversal of effects in 12 months. Hence, it may be possible that the surge in sales and increase in sales quantity is one of a longer duration going up to at least 12months between each cycle. Placebo tests revealed that an approximately 1 % of the patients treated with Propecia experience decreased libido, erectile dysfunction and ejaculation disorder. While genital and urinary drugs help to solve erectile dysfunction, there is no conclusive evidence to support if these side effects contribute to the sales of genital support drugs. | ||
| + | |||
===Customer Analysis=== | ===Customer Analysis=== | ||
<div style="text-align: justify;"> | <div style="text-align: justify;"> | ||
| + | GPs under Medical Groups were compared with their private counterparts in order to ascertain useful insights for Company Z to use when marketing medicines to them. Drilling down the the Medical Group GPs, we find that there was a sharp uptick in the purchases medical group GP driven mainly by a nearly 100% increase in purchases by CGPHMG as seen in the chart below | ||
| + | |||
| + | [[File:MedGroup.png|500px|centre]] | ||
| + | |||
| + | A closer look at CGPHMG shows that this uptick was largely due to a sudden increase in both the variety and quantity of products purchased between 2015 and 2016 particularly in the class of gastrointestinal products | ||
| + | |||
| + | [[File:MedGroupGastro.png|700px|centre]] | ||
| + | |||
| + | A quick snapshot of the buying habits of the Medical Groups contrasted against the CGPs (first column) shows that there is significant heterogeneity within the medical groups. | ||
| + | |||
| + | [[File:MedGroupStack.png|1000px|centre]] | ||
| + | |||
| + | This indicates potential in cross-selling products to these medical groups which may thus drive uptake as in the case of CGPHMG. | ||
| + | |||
===Planning Area: Subzone Analysis=== | ===Planning Area: Subzone Analysis=== | ||
<div style="text-align: justify;"> | <div style="text-align: justify;"> | ||
| + | |||
| + | Postal codes of customers were geocoded using the oneMAP API in R and visualised on top on a population density map. Going forward, proportionate symbols maps would be generated to identify age sensitive product classes | ||
| + | |||
==Pareto Plot Analysis== | ==Pareto Plot Analysis== | ||
| + | [[File:Pareto.png|center]] | ||
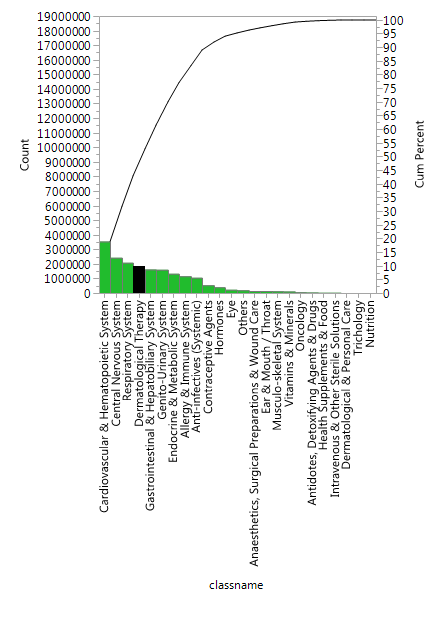
| + | An exploration on an annual basis did not reveal any movements of the key contributors of the 80-20 rule. 8 out of 24 classes types contributes to 80% of the sales revenue. This Pareto presentation would serve to be a meaningful visual aid for Company Z’s portfolio management. | ||
| + | In addition to Pareto analysis on product classes, customer segmentation could also be conducted to allow for identification of high-value customers which would allow Company Z manage its customers better as well as diversify to reduce risks. | ||
<div style="text-align: justify;"> | <div style="text-align: justify;"> | ||
| + | |||
==Specialists== | ==Specialists== | ||
| + | A visual comparison of specialists' purchasing patterns against products of specialty was conducted and it was found that specialists do not only purchase products within their specialty and may purchase products outside their specialty in high amounts. This potentially points to the presence of cross-functional products or may be due to a particularly strong reputation company Z may have in certain products and thus may present a competitive advantage that company Z may consider capitalizing on. | ||
| + | [[File:Spec.png|center]] | ||
| + | As seen in the heat map of specialty plotted against product category, the intensity of the fill corresponds to the percentage of sales quantity of a particular category. From this, we can see that many specialists have top percentage purchases (bold) that fall outside of the specialties (boxed in red) and that purchase of cardiovascular drugs, central nervous system drugs, and dermatological therapy drugs take up a substantial share of the purchase quantity. This runs contrary to our early expectation that specialists would only purchase products that fall within their specialty. This is likely due to the cross-functional uses of certain products found in their prescription information. Another alternative reason could also be that Company Z has a stronger reputation in the sale of these classes of products and hence there is a greater demand for these products even with specialists that do not traditionally use these products. This analysis and discovery of cross-functional uses may prove valuable to Company Z and as such going forward may be beneficial to train Company Z’s sales channels with relevant knowledge to drive meaningful sales. | ||
| + | <div style="text-align: justify;"> | ||
| − | |||
==Pharmacies== | ==Pharmacies== | ||
<div style="text-align: justify;"> | <div style="text-align: justify;"> | ||
===Customer and Sales Trends Exploration=== | ===Customer and Sales Trends Exploration=== | ||
| + | The pharmaceutical customers can be broadly categorized into two groups. They are categorized based on their existing scale of island-wide operations. | ||
| + | The first group consists of three branded chain pharmacies where operations are found throughout Singapore and usually within close proximity of one another. The second refers broadly to independent pharmacies and pharmacy wholesalers that purchase from Company Z to distribute at a more granular level. | ||
| + | [[File:Salesabc.png|700px|center]] | ||
| + | A snapshot view of the contribution of sales to Company Z shows that while each brand operates closely in proximity, the performance varies. Of the three chain pharmacies, pharmacy A and C runs at least twice the number of stores compared to pharmacy B. Despite the size of the operation, pharmacy B seems to contribute a rather significant amount of sales in comparison to A and C.The difference lies in the variety and range of products it carries. This will be further highlighted in the section below. | ||
| + | [[File:Independentpharm.png|700px|center]] | ||
| + | It is interesting to note that while company Z is considered a wholesaler, it continues to deal with pharmacy wholesaler that acts as a middle-man to more independent and granular pharmacy. That said, Company Z should reconsider its pricing strategies so that it is possible to replace o block out pharmacy wholesalers. The above time series shows an upward trend sales contribution for independent companies and a gradual decline from pharmacy wholesalers. | ||
<div style="text-align: justify;"> | <div style="text-align: justify;"> | ||
| + | |||
===Product Categories=== | ===Product Categories=== | ||
| + | A quick overview of sales trends within pharmacies shows that despite being certain chain pharmacies having equal reach and with similar target customer demographics, they do not necessarily have similar purchase patterns be it in the form of product mix or purchase habits. | ||
| + | |||
| + | Product mix of Pharmacy A and C is shown below chronologically: | ||
| + | |||
| + | [[File:CoyATmap.png|600px|center|Pharmacy A]] [[File:CoyCTmap.png|600px|center|Pharmacy C]] | ||
| + | |||
| + | A further drill down to products reveals that Pharmacy A purchases drugs mainly and largely that alleviates problems in Central Nervous system, Allergy and Immune System and Hormones. On the other hand, Pharmacy C consistently carries a wide range of drugs that treats a variety of problems with the largest chunk focusing in Anaesthetics surgical preparatory and wound care, contraceptive agents, respiratory systems and cardiovascular and hematopoietic drugs. | ||
| + | |||
| + | Product mix of Pharmacy B is shown below: | ||
| + | [[File:CoyBTmap.png|600px|center|Pharmacy B]] | ||
| + | |||
| + | The large increment in Pharmacy B's contribution relates largely to Gastrointestinal and Hepatobiliary system drugs that takes up close to 60% of Company Z's sales with Pharmacy B. The main drug driving uptake by Pharmacy B as a whole are 2 products called Biogaia and Vivomixx which are not sold in the other two pharmacies mentioned above. While it does not prove that end consumers regularly demand such drug, it will allow Company Z to add value to its clientele by revealing what its peers are buying to meet their demands. And since each branded chain stores tend to congregate, demand would be similar. | ||
| + | |||
| + | |||
| + | Product mix of Independent Pharmacy is shown below: | ||
| + | [[File:Indepen.png|center]] | ||
| + | The increment in sales contribution by the independent pharmacies is largely due to the shift in product mix, increasing the purchasing of respiratory system and Endocrine and Metabolic system drugs. Independent pharmacies may have been associated largely with experts in treating respiratory problems and seem more reliable in contrast to branded chain stores. This observation would allow Company Z to focus its efforts in their strategic planning efforts to enhance drug sales more effectively. | ||
| + | |||
| + | Product mix of Pharmacy wholesaler is shown below: | ||
| + | [[File:Pharmwholesaler.png|center]] | ||
| + | There were no clear observable patterns from pharmacy wholesaler's product buying patterns. That said, Company Z can aim to reduce the largest portions of its sales to the middle-man further than what it is doing to increase its profit margin by selling directly to the pharmacy retailers. | ||
| − | |||
| − | |||
| − | |||
</div><br> | </div><br> | ||
Latest revision as of 00:18, 24 April 2017
Contents
Exploratory Data Analysis
The intention behind exploratory data analysis is not just to explore the data set but also to understand how Company Z's data can be grouped in a more meaniningful way in the form of visual analytics. The analysis done here would serve as material for the development of the visual dashboard.
Contextual Approach
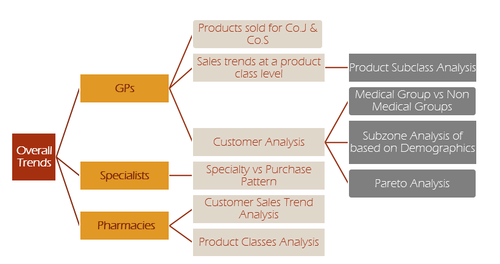
The main focus of Exploratory Data Analysis for the given dataset is to understand and to uncover any purchasing patterns relating to a variety of specific groups of customers. In that regard, our team has identified three main types of customers to focus on and has conducted their respective analyses as shown in the following diagram.
Sales Trends for Company J and S
The names of these companies have been redacted in accordance to the terms and conditions of the Non-Disclosure Agreement (NDA). Nevertheless, Company Z has been engaged by various pharmaceutical companies who wish to utilise Company Z's distribution network by selling medical products on their behalf. A comparison of their sales trends against Company Z's sales trends was done so as to gauge their performance.
Company J only sells products belonging to "Other Dermatologicals" subcategory and Company S only sells products belonging to "Vaccines, Antisera & Immunologicals" subcategory. These sales are compared to Company Z's own sales in those subcategories to better gauge their performance. Sales figures are not to be released in accordance to the terms and conditions of the NDA, however Company S sales has decreased while Company Z's sales have increased during 2014 - 2016, the opposite is observed for Company J where its own sales have increased while Company Z's sales have decreased. A possible explanation for the observed trend is that, demand for Company S's products is decreasing due to Company Z’s customers switching to their competitors products for better prices.
GP Sales Trends on a Product Level
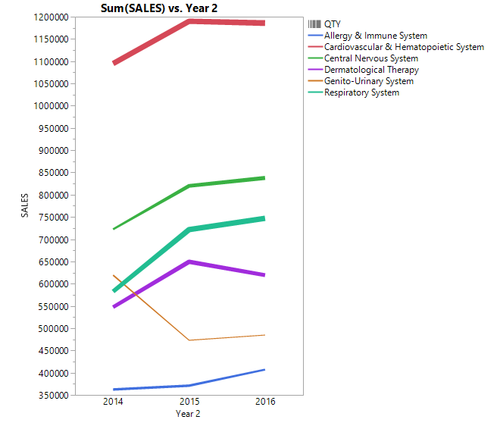
Analysis was conducted for categories of products which contributed 10% or more to the total sales aggregated for the years 2014 - 2016.
We note that overall GP sales have been increasing but growth was slower in 2016 as compared to 2015. On the category level there is an overall increase in sales for all categories except Dermatological Therapy. As the thickness of the lines indicate the quantity of the products sold, it can be inferred that Genito-Urinary System products are being sold at higher prices as compared to the other categories. A possible explanation regarding the increasing trends could be that more patients are seeing GPs for treatment of diseases which fall under those categories. For the decreasing trends, one possible explanation is that patients with illnesses that can be treated with Dermatological Therapy drugs are visiting specialist clinics instead of GPs. Further investigation into each category which contributed 10% of more of total sales and their respective subcategories will be conducted to discover the revenue drivers and any existing seasonal trends if any.
Cardiovascular and Hematopoietic System
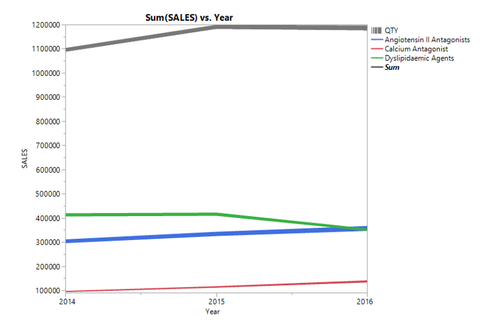
Within this category that contributes 20% to the total sales, the top three subcategory sales, Angiotensin II Antagonists, Dyslipidaemic Agents and Calcium Antagonists were analysed on a yearly and monthly basis to discover any overall patterns and seasonal trends. Drugs belonging to Angiotensin II Antagonists and Calcium Antagonists are used primarily in the treatment of hypertension and hypertension while Dyslipidaemic Agents are used to lower abnormal levels of lipids in the bloodstream.
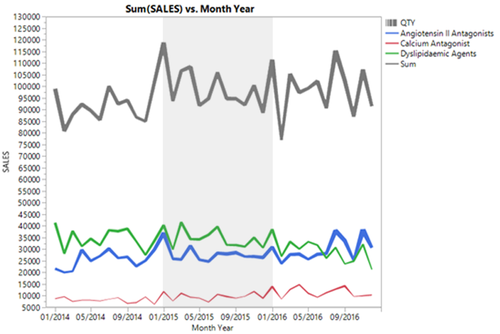
It is observed that sales belonging to Angiotensin II Antagonists and Calcium Antagonists are increasing while sales belonging to Dyslipidaemic Agents are decreasing. These results may be indicative of a greater prevalence of hypertension and high blood pressure coupled with a reduction in Dyslipidaemia amongst the GP’s patients. According to the data provided by Ministry of Health on the prevalence of diseases from age 18 to 69 years, hypertension saw a 23.5% incidence rate, Diabetes for 11.3%, High cholesterol for 17.4%, Obesity for 10.8% and Daily smoking for 14.3%. Of which, these diseases are widely known to be direct causes of heart problems.
As expected, there are no observable sales trends for Cardiovascular & Hematopoietic System products except for the peaks in sales at the end of each year, possibly due to closure of offices in response to the New Year Holiday.
Genito-Urinary System
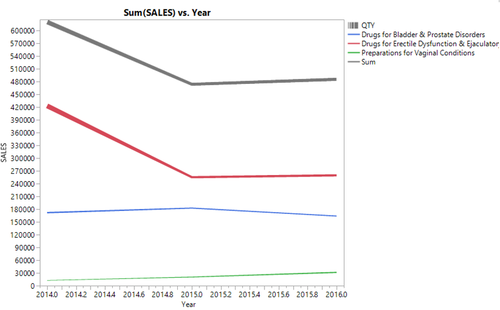
The next highest category contributes about 12% of the total sales. The main driver of this category comes from Drugs for Erectile Dysfunction & Ejaculatory Disorders, followed by Drugs for Bladder & Prostate Disorders and Preparations for Vaginal Conditions. The following graph shows the yearly change in sales.
Drugs for Erectile Dysfunction & Ejaculatory Disorders outperform the other 2 categories in terms of sales but it’s sales have decreased overall whereas sales in the other 2 categories showed increased growth overall. The sharp decreases in Drugs for Erectile Dysfunction & Ejaculatory Disorders corresponds with the large decrease in sales for its overall category. Overall, we note that sales have decreased from 2014 despite a slight improvement from 2015. However, the bulk of that increase comes from products sold under Drugs for Erectile Dysfunction & Ejaculatory Disorders. Further investigation into this subcategory reveals that the top sellers are Viagra and Cialis, both used to treat erectile dysfunction (impotence).
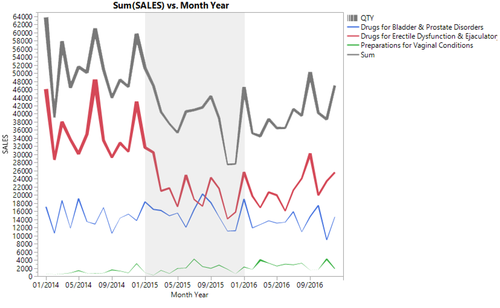
A monthly sales trend was plotted for these three subcategories to ascertain the existence of any seasonal trends.
There seems to be no observable seasonal trend for all 3 subcategories, however, we note that the overall trend for Drugs for Erectile Dysfunction & Ejaculatory Disorders is decreasing while the other two subcategories shows a very slight increase in sales.
These trends highlight the high incidence of males suffering from Genito-Urinary conditions (particularly erectile dysfunction and impotence) as compared to their female counterparts. However, female patients with their respective Genito-Urinary conditions though small in number are on the rise and GPs would do well to prepare sufficient medications for them.
Respiratory System
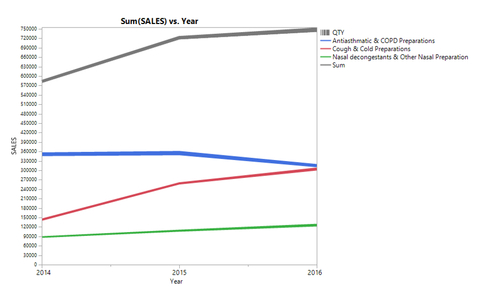
This category contributed about 12% of Company Z's total revenue and it consists of three subcategories, Antiasthmatic & COPD Preparations, Cough & Cold Preparations, Nasal Decongestants & Other Nasal Preparations. The graph below shows the yearly sales trend of this category.
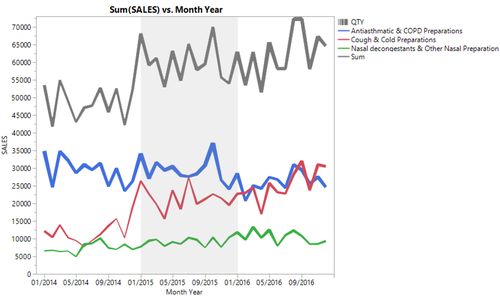
A monthly sales trend was also plotted as follows:
There seems to be no clear seasonal trend overall, that being said, it is noted that sales for Respiratory System has been increasing overall and this is attributable to the large revenue growth in Cough & Cold Preparations as well as Nasal decongestants & Other Nasal Preparations. These two subcategories have experienced a significant increase in sales from 2015 to 2016 which also coincided with news reports about avian flu and Middle East Respiratory Syndrome (MERS). This could be indicative of GP’s anticipating larger numbers of patients with flu-like symptoms or that there was an increased amount of patients who suffered from coughs and colds in the year 2016.
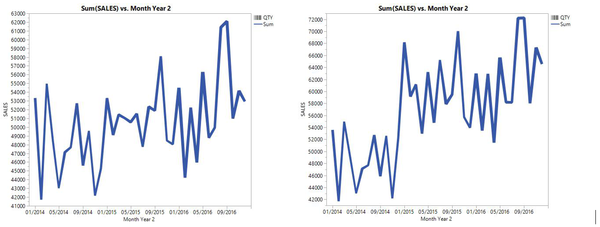
Drilling down further, we can identify that the main product driving increases in cough and cold preparations is that of Zyrtec and Zyrtec-D with a distinct difference between the total sales of this category with (right image) and without (left image) including these 2 products.
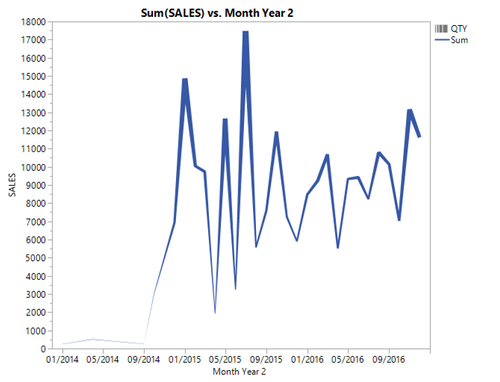
We can also see that these 2 products have picked up in popularity over the past few years as seen from the chart below of the sum of sales of these products alone and this may be the result of more aggressive marketing or a greater prescription rate of these medicines.
Central Nervous System
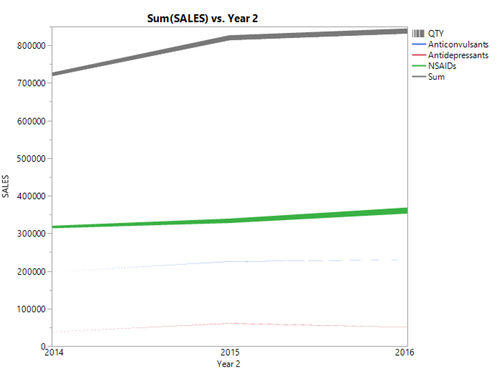
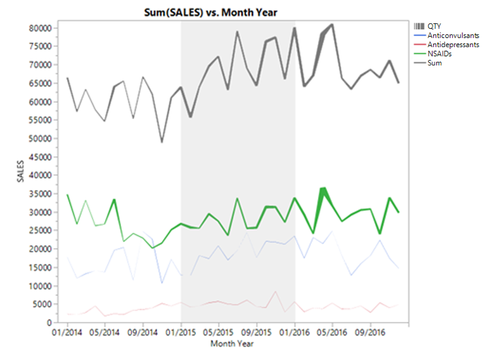
This category contributed about 10% of the total sales revenue with the top 3 subcategories as follows, NSAIDs (Nonsteroidal anti-inflammatory drugs, commonly known as painkillers), Anticonvulsants and Antidepressants. Anticonvulsants are used to treat epileptic seizures while antidepressants are used to treat anxiety disorders such as depression and Obsessive Compulsive Disorder.
The following graph is the yearly sales trend of the top 3 subcategories:
Followed by a monthly sales trend of those categories:
Seasonal patterns are not expected since the use of such a drug is broad and can be used to suppress discomfort. Although it can be observed that they sales quantity has grown over time, it is still unknown if such an increment in suppressants is due to an increase in the lack of pain tolerance or an increase in quality treatment by relieving pain. Overall, all 3 subcategories experienced growth in sales which may be indicative of an increased prevalence of epilepsy and neurological disorders. However, the increased rate of growth in sales for Anticonvulsants may possibly be indicative of an increased rate of epilepsy in the GPs’ patients. The increased sales for Antidepressants may be attributed to a paradigm shift in anxiety disorders in especially stressful environment as according to The Straits Times.
The low sales quantity may suggest that psychological stresses are usually treated more commonly in hospitals and by specialists instead of regular GPs while NSAIDs’ application is more widely found in GP’s prescriptions. This analysis may prove to help Company Z to understand the synergy between drug uses and end consumer needs. Going forward, should quantity decrease or increase respectively, it would help company Z paint a clearer picture of end consumer needs through buying patterns of GP.
Allergy & Immnue System
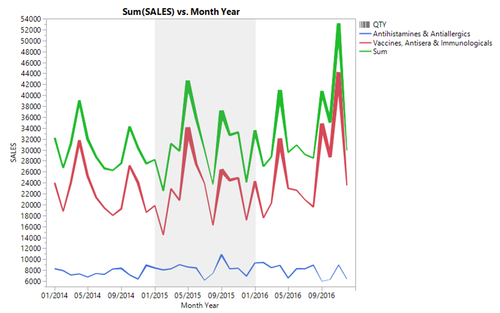
This category contributed approximately 10% of the total sales and consists of two subcategories, Antihistamines & Antiallergics and Vaccines, Antisera & Immunologicals.
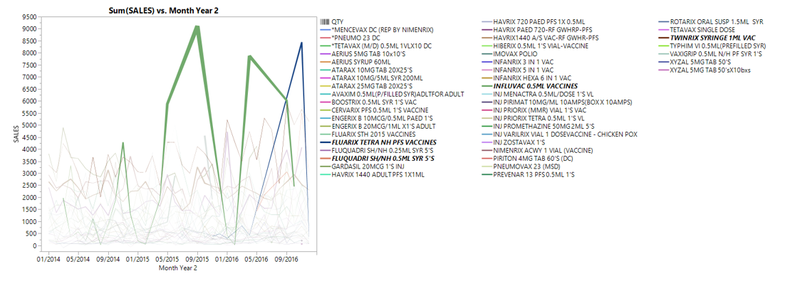
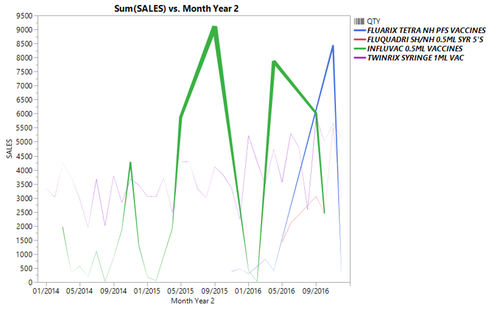
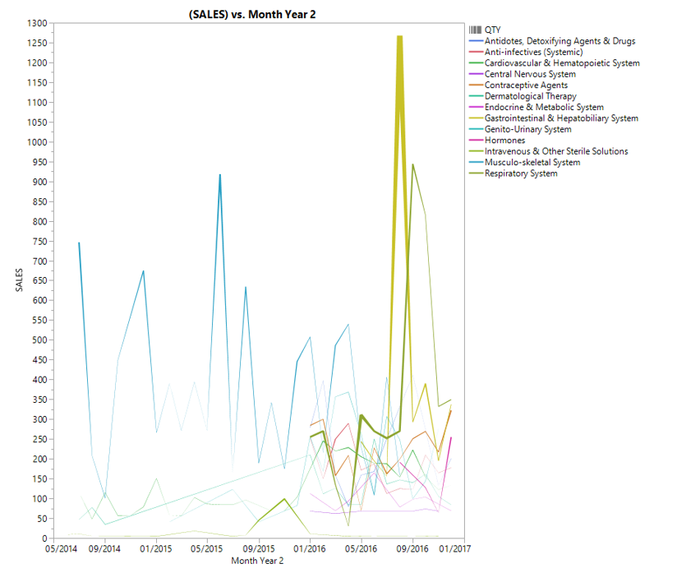
Key trends that can be observed on a MoM basis is that Vaccines, Antisera and Immunological generally spike twice a year once around May and another around August. Drilling down, we find that 3 of the key products that are driving growth in this aspect are both flu vaccines and also a Hepatitis A & B vaccine. This may be due to rising awareness of vaccination against the influenza as well as Hepatitis A & B. It is also interesting to note that this follows the period in which there were healthcare policies implementations such that Medisave could be used for flu vaccinations. The spikes also occurred during the MERS scare and the recent avian flu scares
Dermatological Therapy
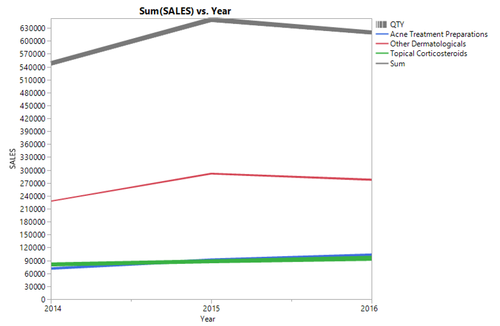
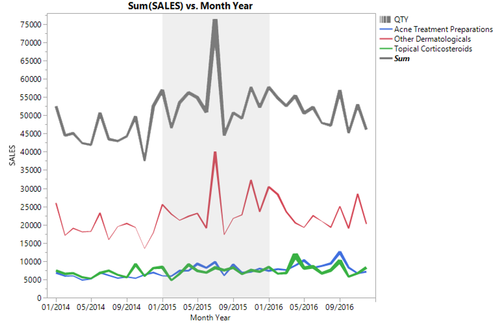
The next category for analysis is Dermatological Therapy which has several subcategories. The majority of its sales comes from ‘Other Dermatologicals’ of which a drug called Propecia forms 75.42% of that subcategory’s total sales. Propecia is commonly used for treating male pattern hair loss. The next highest contributor comes from Acne Treatment Preparations followed by Topical Corticosteroids which are used for treating rashes and eczema. The following graph is a yearly sales trend of the subcategories:
A monthly sales trend was also plotted as follows:
As Acne Treatment Preparations and Topical corticosteroids provides solutions to persistent problems, there is a rather stable trend throughout the months. It is noteworthy to mention that both subclasses saw an increase in sales quantity from 2014 to 2016.
Sales for all 3 subcategories peaked during 2015 before decreasing in 2016, especially for Other Dermatologicals which saw sales drop past its 2014 levels. These decreases in sales could possibly be the result of a small number patients choosing to visit specialist clinics for their dermatological illnesses instead of GPs. While it also shows Propecia’s worsening performance, it is unlikely that it is due to loss of users but instead relates to the prescription methodology. A minimum of 3 months with daily intake is required to see results, while a withdrawal from treatment would see reversal of effects in 12 months. Hence, it may be possible that the surge in sales and increase in sales quantity is one of a longer duration going up to at least 12months between each cycle. Placebo tests revealed that an approximately 1 % of the patients treated with Propecia experience decreased libido, erectile dysfunction and ejaculation disorder. While genital and urinary drugs help to solve erectile dysfunction, there is no conclusive evidence to support if these side effects contribute to the sales of genital support drugs.
Customer Analysis
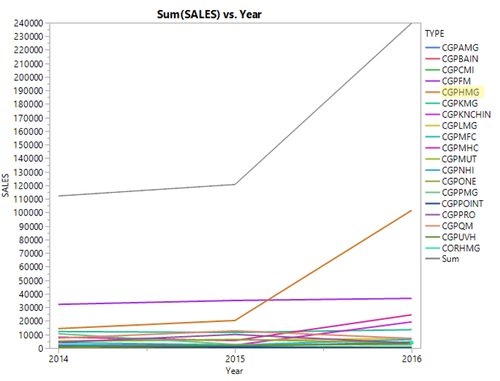
GPs under Medical Groups were compared with their private counterparts in order to ascertain useful insights for Company Z to use when marketing medicines to them. Drilling down the the Medical Group GPs, we find that there was a sharp uptick in the purchases medical group GP driven mainly by a nearly 100% increase in purchases by CGPHMG as seen in the chart below
A closer look at CGPHMG shows that this uptick was largely due to a sudden increase in both the variety and quantity of products purchased between 2015 and 2016 particularly in the class of gastrointestinal products
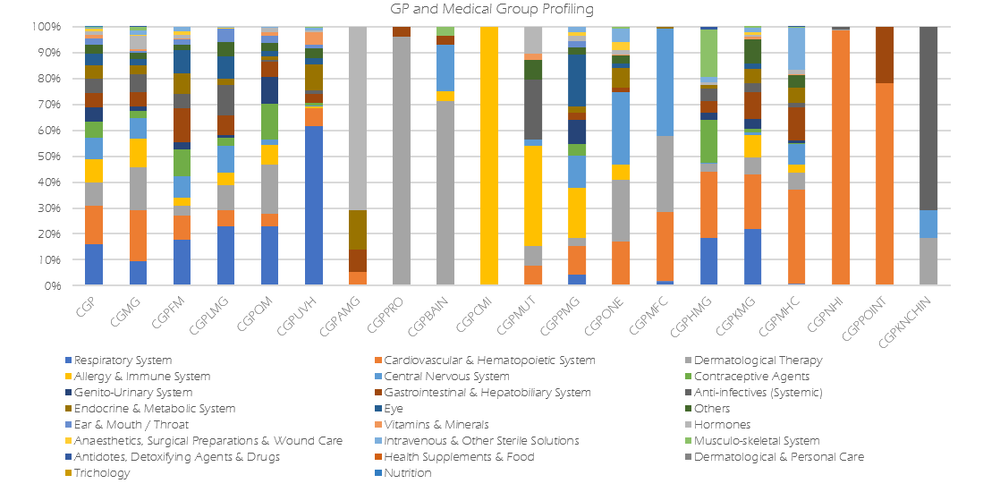
A quick snapshot of the buying habits of the Medical Groups contrasted against the CGPs (first column) shows that there is significant heterogeneity within the medical groups.
This indicates potential in cross-selling products to these medical groups which may thus drive uptake as in the case of CGPHMG.
Planning Area: Subzone Analysis
Postal codes of customers were geocoded using the oneMAP API in R and visualised on top on a population density map. Going forward, proportionate symbols maps would be generated to identify age sensitive product classes
Pareto Plot Analysis
An exploration on an annual basis did not reveal any movements of the key contributors of the 80-20 rule. 8 out of 24 classes types contributes to 80% of the sales revenue. This Pareto presentation would serve to be a meaningful visual aid for Company Z’s portfolio management. In addition to Pareto analysis on product classes, customer segmentation could also be conducted to allow for identification of high-value customers which would allow Company Z manage its customers better as well as diversify to reduce risks.
Specialists
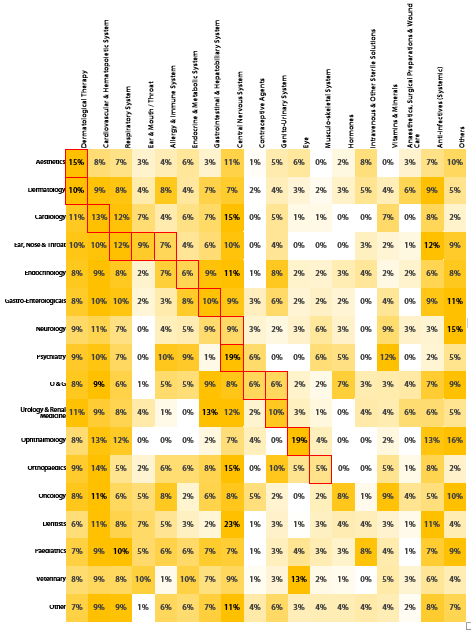
A visual comparison of specialists' purchasing patterns against products of specialty was conducted and it was found that specialists do not only purchase products within their specialty and may purchase products outside their specialty in high amounts. This potentially points to the presence of cross-functional products or may be due to a particularly strong reputation company Z may have in certain products and thus may present a competitive advantage that company Z may consider capitalizing on.
As seen in the heat map of specialty plotted against product category, the intensity of the fill corresponds to the percentage of sales quantity of a particular category. From this, we can see that many specialists have top percentage purchases (bold) that fall outside of the specialties (boxed in red) and that purchase of cardiovascular drugs, central nervous system drugs, and dermatological therapy drugs take up a substantial share of the purchase quantity. This runs contrary to our early expectation that specialists would only purchase products that fall within their specialty. This is likely due to the cross-functional uses of certain products found in their prescription information. Another alternative reason could also be that Company Z has a stronger reputation in the sale of these classes of products and hence there is a greater demand for these products even with specialists that do not traditionally use these products. This analysis and discovery of cross-functional uses may prove valuable to Company Z and as such going forward may be beneficial to train Company Z’s sales channels with relevant knowledge to drive meaningful sales.
Pharmacies
Customer and Sales Trends Exploration
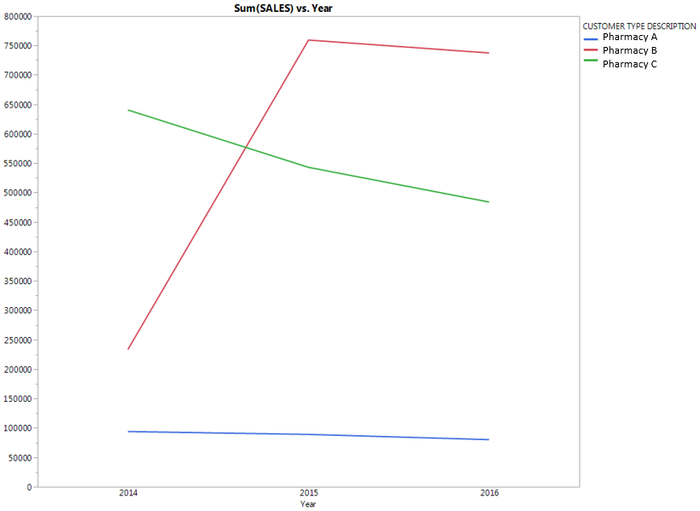
The pharmaceutical customers can be broadly categorized into two groups. They are categorized based on their existing scale of island-wide operations. The first group consists of three branded chain pharmacies where operations are found throughout Singapore and usually within close proximity of one another. The second refers broadly to independent pharmacies and pharmacy wholesalers that purchase from Company Z to distribute at a more granular level.
A snapshot view of the contribution of sales to Company Z shows that while each brand operates closely in proximity, the performance varies. Of the three chain pharmacies, pharmacy A and C runs at least twice the number of stores compared to pharmacy B. Despite the size of the operation, pharmacy B seems to contribute a rather significant amount of sales in comparison to A and C.The difference lies in the variety and range of products it carries. This will be further highlighted in the section below.
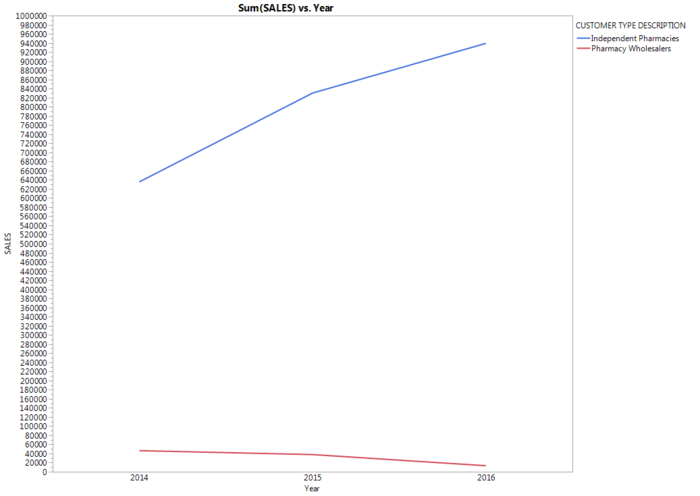
It is interesting to note that while company Z is considered a wholesaler, it continues to deal with pharmacy wholesaler that acts as a middle-man to more independent and granular pharmacy. That said, Company Z should reconsider its pricing strategies so that it is possible to replace o block out pharmacy wholesalers. The above time series shows an upward trend sales contribution for independent companies and a gradual decline from pharmacy wholesalers.
Product Categories
A quick overview of sales trends within pharmacies shows that despite being certain chain pharmacies having equal reach and with similar target customer demographics, they do not necessarily have similar purchase patterns be it in the form of product mix or purchase habits.
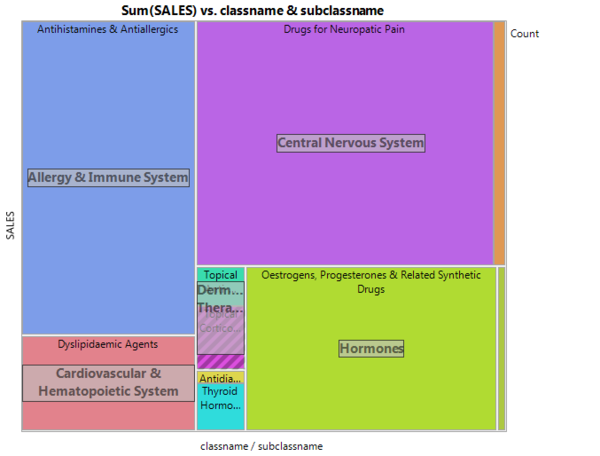
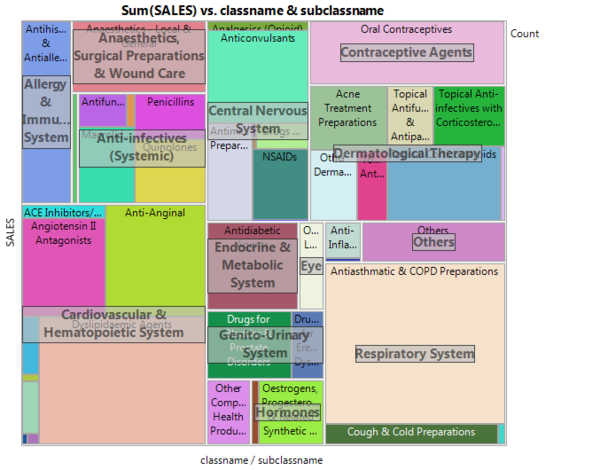
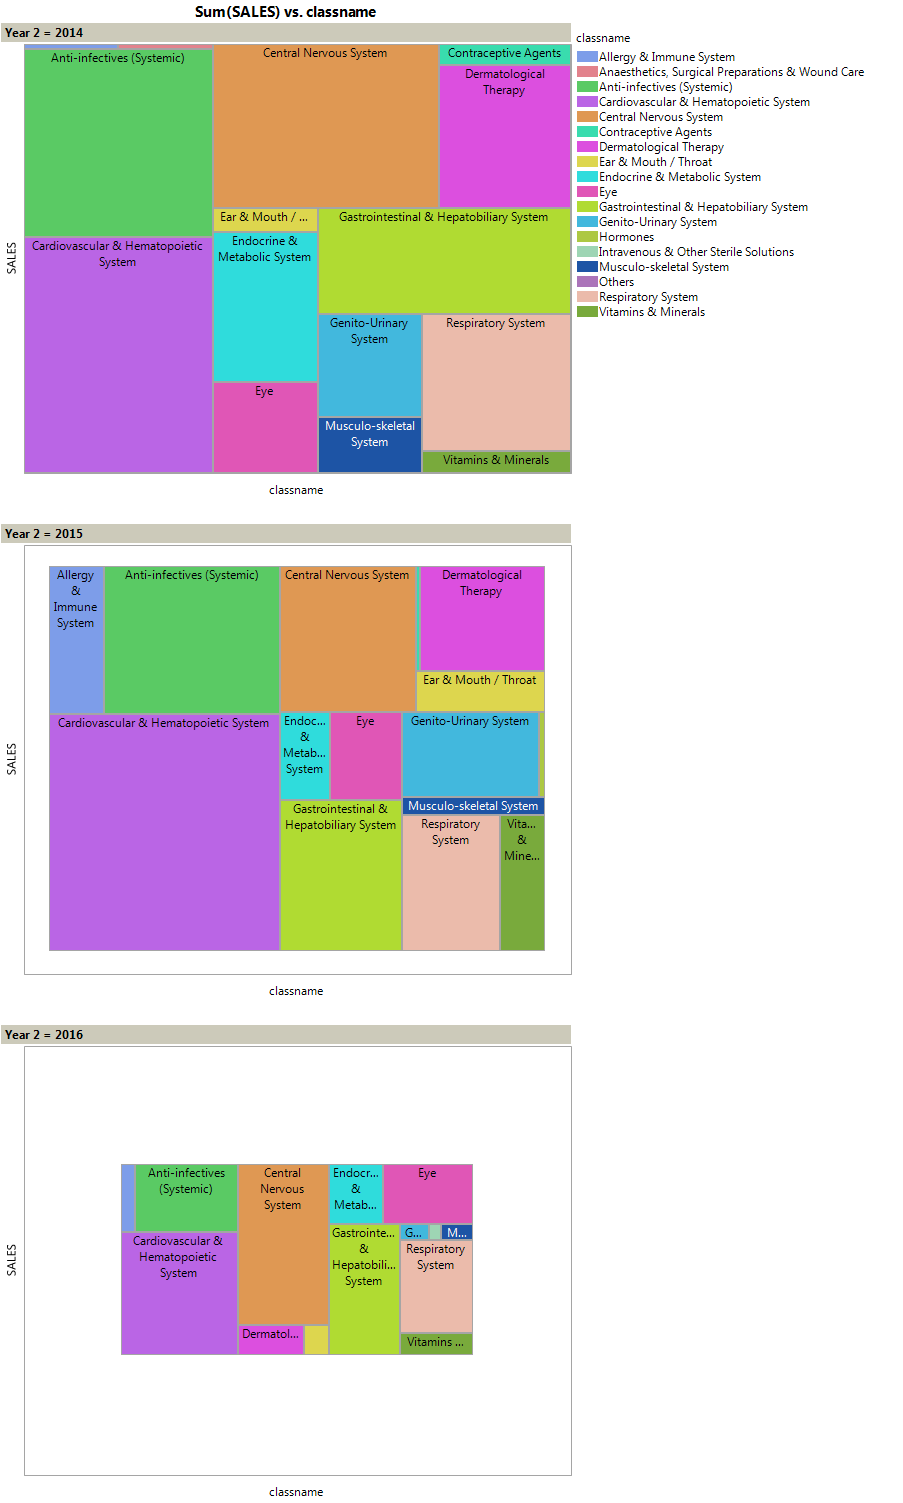
Product mix of Pharmacy A and C is shown below chronologically:
A further drill down to products reveals that Pharmacy A purchases drugs mainly and largely that alleviates problems in Central Nervous system, Allergy and Immune System and Hormones. On the other hand, Pharmacy C consistently carries a wide range of drugs that treats a variety of problems with the largest chunk focusing in Anaesthetics surgical preparatory and wound care, contraceptive agents, respiratory systems and cardiovascular and hematopoietic drugs.
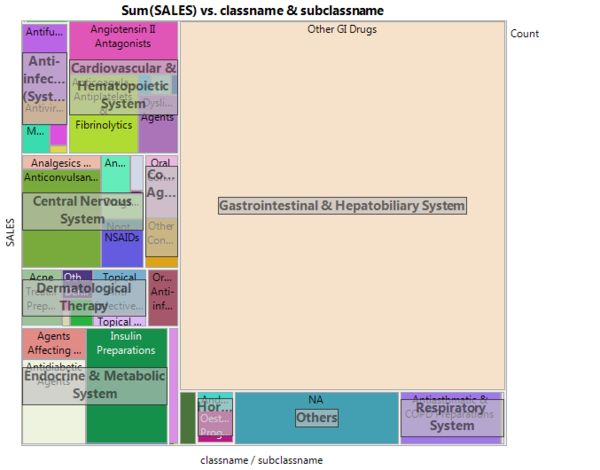
Product mix of Pharmacy B is shown below:
The large increment in Pharmacy B's contribution relates largely to Gastrointestinal and Hepatobiliary system drugs that takes up close to 60% of Company Z's sales with Pharmacy B. The main drug driving uptake by Pharmacy B as a whole are 2 products called Biogaia and Vivomixx which are not sold in the other two pharmacies mentioned above. While it does not prove that end consumers regularly demand such drug, it will allow Company Z to add value to its clientele by revealing what its peers are buying to meet their demands. And since each branded chain stores tend to congregate, demand would be similar.
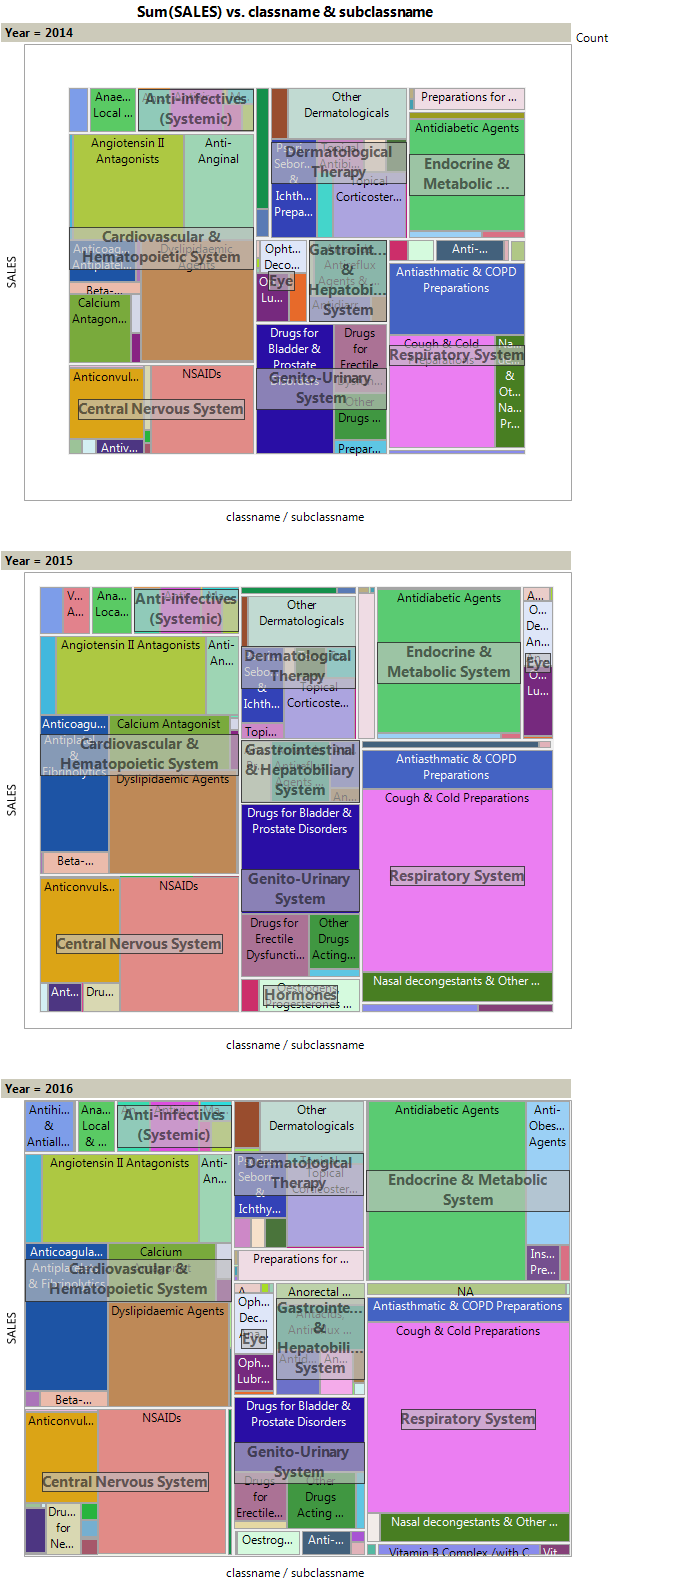
Product mix of Independent Pharmacy is shown below:
The increment in sales contribution by the independent pharmacies is largely due to the shift in product mix, increasing the purchasing of respiratory system and Endocrine and Metabolic system drugs. Independent pharmacies may have been associated largely with experts in treating respiratory problems and seem more reliable in contrast to branded chain stores. This observation would allow Company Z to focus its efforts in their strategic planning efforts to enhance drug sales more effectively.
Product mix of Pharmacy wholesaler is shown below:
There were no clear observable patterns from pharmacy wholesaler's product buying patterns. That said, Company Z can aim to reduce the largest portions of its sales to the middle-man further than what it is doing to increase its profit margin by selling directly to the pharmacy retailers.

