Difference between revisions of "Car Park Overspill Study PROJECT DOCUMENTATION FINAL"
| Line 128: | Line 128: | ||
The picture above describes a driver’s decision making process when enters a carpark. He will have a rough idea of the occupancy rate in the carpark since most of the Singapore carpark shows the number of vacancies at the entrance. If he thinks that occupancy rate is generally low, he will prefer to find a parking space which is near to the destination, in this context the lift or the shop that he wants to go, so that he can minimize the walking distance. The action will be to travel to the area which he thinks is close enough and if there are any vacancies left, he will choose any one of them. On the other hand, if he thinks the occupancy rate is high, the strategy is to find a parking space which is as optimal as possible. In this case, if a vacancy can be found near area which has many parked cars, it is probably a good choice since many people choose to park here while the occupancy rate is high. | The picture above describes a driver’s decision making process when enters a carpark. He will have a rough idea of the occupancy rate in the carpark since most of the Singapore carpark shows the number of vacancies at the entrance. If he thinks that occupancy rate is generally low, he will prefer to find a parking space which is near to the destination, in this context the lift or the shop that he wants to go, so that he can minimize the walking distance. The action will be to travel to the area which he thinks is close enough and if there are any vacancies left, he will choose any one of them. On the other hand, if he thinks the occupancy rate is high, the strategy is to find a parking space which is as optimal as possible. In this case, if a vacancy can be found near area which has many parked cars, it is probably a good choice since many people choose to park here while the occupancy rate is high. | ||
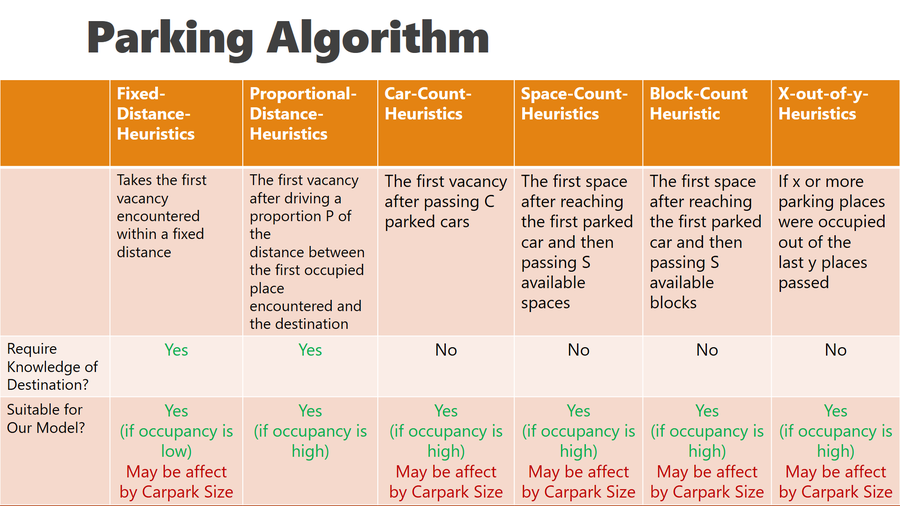
| − | With these 2 simple behavior in mind, we want to find parking algorithm which suits them the best. After reading through several research papers, especially in the paper Car Parking as a Game Between Simple Heuristics (John M. C. utchinson Carola Fanselow Peter M. Todd, 2012). We managed to find few parking algorithms which can possibly be used:<br /> | + | With these 2 simple behavior in mind, we want to find parking algorithm which suits them the best. After reading through several research papers, especially in the paper [http://www.indiana.edu/~abcwest/pmwiki/pdf/hutchinson.car%20parking.2012.pdf Car Parking as a Game Between Simple Heuristics (John M. C. utchinson Carola Fanselow Peter M. Todd, 2012)]. We managed to find few parking algorithms which can possibly be used:<br /> |
[[File:Car Park Overspill Study PROJECT DOCUMENTATION FINAL P5.PNG|center|900px]] | [[File:Car Park Overspill Study PROJECT DOCUMENTATION FINAL P5.PNG|center|900px]] | ||
=== Model Interface === | === Model Interface === | ||
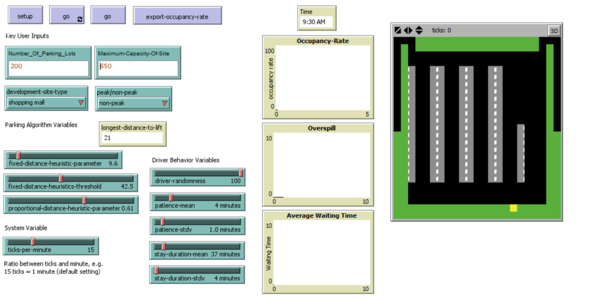
[[File:Car Park Overspill Study PROJECT DOCUMENTATION FINAL P7.PNG|center|600px]] | [[File:Car Park Overspill Study PROJECT DOCUMENTATION FINAL P7.PNG|center|600px]] | ||
Revision as of 14:13, 17 April 2016
Contents
Preliminary Phase
Scope
Our sponsor requires us to finish 5 final reports of different development sites during the preliminary phase of our project. The necessary data and infographics are prepared by the sponsor and his tea, our job scope is to compile the report using the sample template and interpret the data to generate some insights which can be helpful for LTA future planning. A typical final report contains the following components:
- Executive Summary
- Site Background
- Site Characteristics
- Site Assessment
- Survey Findings
- Conclusion
“Executive Summary” gives a brief overview of the report and its conclusion. “Site Background”, “Site Characteristics” and “Site Assessment” provides the basic information of the site, such as the nature, the size, the transportation availability of the site and etc. Our focus is on “Survey Findings” which uses the data collected on both weekday and weekend at the site to generate some insights. The generated insights elaborate on the vehicles traffic pattern, the human traffic during different period of the day and most importantly whether there is overspill, this helps LTA understands the utilization rate of the car park and make certain adjustments in the future.
Actual Deliverables
By the end of the preliminary phase, our group has finished 5 final reports as planned at the beginning of the project. These 5 final reports are:
- Final Report - Greenwood Ave & Hillcrest Rd
- Final Report - Vivocity
- Final Report - Frankel Ave
- Final Report - Jalan Mata Ayer
- Final Report - Yuhua Market & Hawker Centre
Phase 2
Revised Methodology
We have revised our goal of Phase 2, instead of building a simulation tool with projection of a car park together with its surrounding environment such as streets and roads, now we aim to let the tool to simulate a car park inside traffic only. Considering the raw data at hand, it includes surveyed car parks inbound and outbound traffic. The data become more meaningful when we uncover the pattern of car arriving at a car park and apply the pattern into a model which simulates the traffic inside a car park only. Therefore, we redefined the Phase 2 objective, and accordingly we update the preparing data process to suit the updated needs.
Data Preparation
To help us understand the traffic situation inside a car park, we process the raw data in the following steps:
1. Based on the nature of the car park's associated site, hence, we categorized 4 sets of data - Shopping Malls, F&B Clusters, Community Clubs, and Hawker Centres. The following table shows the basic information of each category:
| Site Category | Shopping Mall | Community Club | Hawker Centre | F&B Cluster |
|---|---|---|---|---|
| Num of Samples | 17 | 10 | 10 | 7 |
| Survey Periods | 10am - 9pm (Weekday & Weekend) | 9am - 6pm (Weekend), 2pm - 10pm (Weekday) | 7am - 3pm (Weekday & Weekend), 6pm - 8pm(Weekday) | 10am - 10pm (Weekday & Weekend) |
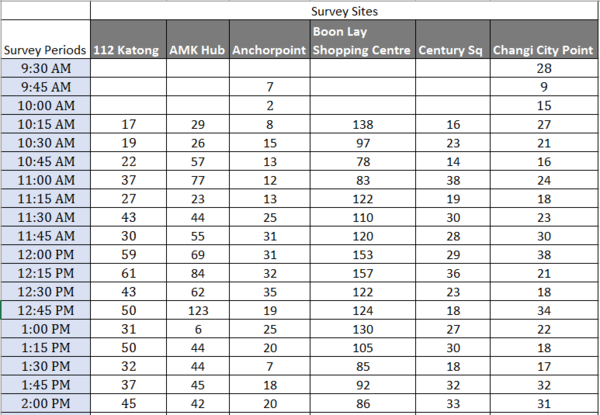
2. Organize the Inbound Traffic data of each site in a site category, such that we have a collection of data showing the number of arriving cars at each car park in each 15 minutes interval from 7:00 am to 10:00 pm. The following screen shot shows an example of the collection of data of Shopping Mall Category sites:
3. We understand that the car parks' associated development site have varied capacities in accommodating patrons or customers, so we normalized the data , by applying below formula:
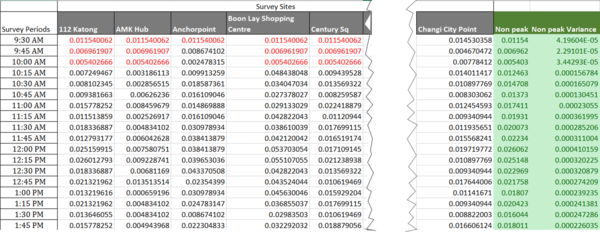
The following screen shot shows an instance of data has been normalized:
4. After normalizing the data, in each site category, we still found a few outliers with normalized value deviating from the mean value greatly. To ensure that the data as input is effective in representing the general cases to the agent-based model we build, we have to remove those outliers. The following plot chart shows an example of the effect before and after removing the outliers:
Implementation of Agent-based Model
Agent-based modelling is particularly interesting to us in this simulating and assessing car park effectiveness problem, as this problem involves interactions between different objects (e.g. cars and parking lots, cars and junctions etc.) and also interactions among same objects (e.g. cars) in a car park. In the meantime, the rule or behaviour followed by each object is relatively simpler to find out and define. In the context, users are interested to know not only the qualitative results of assessing the effectiveness of a car park, but also the detailed interactions and even the cause of a particular interaction. Agent based modelling is approved to be a good approach in applying into our problem context.
Model Introduction
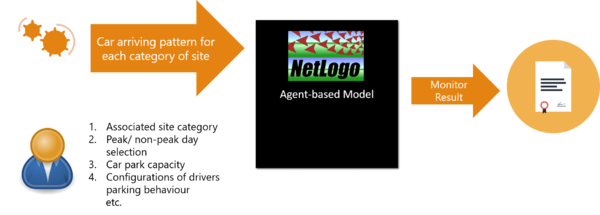
The following diagram abstractly shows the inputs the simulation model needs and the output it generates. It takes two sorts of inputs:
1. built-in configurations:
Processed data in earlier stage is used here are configuration for the model when simulation the pattern of arriving cars at a car park. It will be scaled up proportionally to one of the user inputs - Car Park Capacity - and generate the number of arriving cars in each time interval.
2. User inputs and heuristic algorithm configuration parameters:
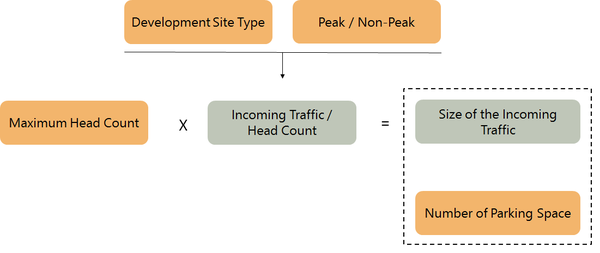
There are 4 key user inputs which have to be specified before the simulation of the model. They are “Development Site Type”, “Peak/Non-Peak”, “Maximum Head Count” and “Number of Parking Space” as highlighted in orange in the pictures above.
Based on “Development Site Type” and “Peak/Non-Peak”, we will retrieve the processed data which belongs to the 2 categories and this data will be used to calculate the “incoming Traffic / Head Count” at different time periods of the day. Next, the user will use “Maximum Head Count” to specify the rough size of the development site, for example, 1000 indicates that the development site will hold roughly maximum 1000 persons. We multiple the head count with the incoming traffic to find out the “Size of the Incoming Traffic” which is relative to the size of the development site. Lastly, we will generate the cars at different periods based on this data, the cars will interact with each other and also the world to see whether the “Number of Parking Space” entered by the user is enough for such development site.
3. Output Charts:
The Model will monitor and display the Occupancy Rate, Number of Overspills, and Average Waiting Time dynamically.
Defining agent behavior
There are 2 types of agents in our model, patches and turtles. Patches refer the group units in the environment which are used to facilitate turtles’ behaviour, we have 3 patches, “Road”, “Parking Space” and “Wall”. Turtles refer to class of agents which travels and interacts in the environment, we have 1 turtles class, “Car”.
“Road” is used to allow cars to move around, but additionally, some of the “Road” are identified as “Entrance” which only allows “Cars” to enter into the carpark, “Exit” which only allows “Car” to exit from the carpark and “Crossroad” which allows the cars to make turns. “Parking Space” is used to identify parking slots in the carpark, it will be labelled as “yes” to park if there is no cars on it, the status will be changed to “parked” if there is a car parking on it. “Wall” is simply used to define the boundary of the carpark and the cars will not be able to drive pass “Wall” patches.
“Car” is slightly more complex to define. It has 4 basic behaviours, firstly, it must follow basic traffic rules, in our context, a car must drive on the left of the road and only make turns at crossroad. Secondly, a car or a driver will try to find the optimal place to park the car until the patience runs out, we uses “Patience” variable to describe the car or driver’s patience, it is modelled using normal distribution with user’s input of its mean and standard deviation. If the patience of the driver runs out, he will choose to park whenever he encounters the first free parking space. Thirdly, the driver will leave the carpark after the “Stay Duration” is reached. Similarly, “Stay Duration” is modelled using normal distribution with user’s inputs as well. Lastly, we introduce the idea “Randomness” since not all the drivers will follow the optimal parking algorithm, different drivers may make different decisions based on their own preferences. Hence, we give the driver a “Randomness” variable to make the decision making process more realistic.
Parking Algorithm
Before we discussed the detailed parking algorithm, we have to first understand drivers’ behaviour in normal daily life and transform it into algorithm which best describes it in order to achieve more realistic and accurate simulation result.
The picture above describes a driver’s decision making process when enters a carpark. He will have a rough idea of the occupancy rate in the carpark since most of the Singapore carpark shows the number of vacancies at the entrance. If he thinks that occupancy rate is generally low, he will prefer to find a parking space which is near to the destination, in this context the lift or the shop that he wants to go, so that he can minimize the walking distance. The action will be to travel to the area which he thinks is close enough and if there are any vacancies left, he will choose any one of them. On the other hand, if he thinks the occupancy rate is high, the strategy is to find a parking space which is as optimal as possible. In this case, if a vacancy can be found near area which has many parked cars, it is probably a good choice since many people choose to park here while the occupancy rate is high.
With these 2 simple behavior in mind, we want to find parking algorithm which suits them the best. After reading through several research papers, especially in the paper Car Parking as a Game Between Simple Heuristics (John M. C. utchinson Carola Fanselow Peter M. Todd, 2012). We managed to find few parking algorithms which can possibly be used:
