Difference between revisions of "AY1516 T2 Team CommuteThere Project Data Preparation"
(Created page with "<center> 500px </center> <!------- Main Navigation Bar----> <center> {| style="background-color:#ffffff ; margin: 3px 10px 3px 10px; width="80%"...") |
|||
| (37 intermediate revisions by 2 users not shown) | |||
| Line 11: | Line 11: | ||
| style="font-family:Open Sans, Arial, sans-serif; font-size:15px; text-align: center; border-top:solid #ffffff; border-bottom:solid #f5f5f5" width="210px" | | | style="font-family:Open Sans, Arial, sans-serif; font-size:15px; text-align: center; border-top:solid #ffffff; border-bottom:solid #f5f5f5" width="210px" | | ||
[[AY1516_T2_Team_CommuteThere_Overview|<font color="#3c3c3c"><strong>PROJECT OVERVIEW</strong></font>]] | [[AY1516_T2_Team_CommuteThere_Overview|<font color="#3c3c3c"><strong>PROJECT OVERVIEW</strong></font>]] | ||
| + | |||
| + | | style="font-family:Open Sans, Arial, sans-serif; font-size:15px; text-align: center; border-top:solid #ffffff; border-bottom:solid #0091b3" width="190px" | | ||
| + | [[AY1516_T2_Team_CommuteThere_Project_Data_Preparation|<font color="#3c3c3c"><strong>ANALYSIS & FINDINGS</strong></font>]] | ||
| style="font-family:Open Sans, Arial, sans-serif; font-size:15px; text-align: center; border-top:solid #ffffff; border-bottom:solid #f5f5f5" width="230px" | | | style="font-family:Open Sans, Arial, sans-serif; font-size:15px; text-align: center; border-top:solid #ffffff; border-bottom:solid #f5f5f5" width="230px" | | ||
| Line 18: | Line 21: | ||
[[AY1516_T2_Team_CommuteThere_Main Deliverables|<font color="#3c3c3c"><strong>DOCUMENTATION</strong></font>]] | [[AY1516_T2_Team_CommuteThere_Main Deliverables|<font color="#3c3c3c"><strong>DOCUMENTATION</strong></font>]] | ||
| − | |||
| − | |||
|} | |} | ||
</center> | </center> | ||
| Line 41: | Line 42: | ||
<!-- Body --> | <!-- Body --> | ||
| − | ==<div style="background: #ffffff; padding: 17px; line-height: 0.1em; text-indent: 10px; font-size:17px; font-family: Helvetica; border-left:8px solid #0091b3"><font color= #000000><strong>Data | + | ==<div style="background: #ffffff; padding: 17px; line-height: 0.1em; text-indent: 10px; font-size:17px; font-family: Helvetica; border-left:8px solid #0091b3"><font color= #000000><strong>Main Data Sets</strong></font></div>== |
| − | <div style="margin:0px; padding: 10px; background: #f2f4f4; font-family: Arial, sans-serif; border-radius: 7px; text-align:left"> | + | <div style="margin:0px; padding: 10px; background: #f2f4f4; font-family: Open Sans, Arial, sans-serif; border-radius: 7px; text-align:left"> |
| − | + | ||
| + | <center> | ||
| + | {| style="background-color:#ffffff ; margin: 3px 10px 3px 10px; font-size:15px" width="100%" | ||
| + | |- style="background:#f2f4f4; font-size:17px" | ||
| + | |||
| + | |- | ||
| + | | style="font-family:Open Sans, Arial, sans-serif; font-size:16px; text-align: center; padding:5px; border-bottom:solid #0091b3" | <font color="#3c3c3c"><strong>Name of Data</strong></font> | ||
| + | | style="font-family:Open Sans, Arial, sans-serif; font-size:16px; text-align: center; padding:5px; border-bottom:solid #0091b3" | <font color="#3c3c3c"><strong>Nature of Data</strong></font> | ||
| + | | style="font-family:Open Sans, Arial, sans-serif; font-size:16px; text-align: center; padding:5px; border-bottom:solid #0091b3" | <font color="#3c3c3c"><strong>Number of Records (after cleaning)</strong></font> | ||
| + | |||
| + | |- | ||
| + | | style="font-family:Open Sans, Arial, sans-serif; text-align: center; padding:3px 10px; border-bottom:solid 1px #d8d8d8" | <strong>bus_service_mapping</strong> | ||
| + | | style="font-family:Open Sans, Arial, sans-serif; text-align: center; padding:3px 10px; border-bottom:solid 1px #d8d8d8" | The actual bus service numbers are provided alongside with the bus service ids together with the date of entry of data into the database. The more recent the data depicts a more updated record. | ||
| + | | style="font-family:Open Sans, Arial, sans-serif; text-align: center; padding:3px 10px; border-bottom:solid 1px #d8d8d8" | 335 | ||
| + | |||
| + | |- | ||
| + | | style="font-family:Open Sans, Arial, sans-serif; text-align: center; padding:3px 10px; border-bottom:solid 1px #d8d8d8" | <strong>location_gis_mapping</strong> | ||
| + | | style="font-family:Open Sans, Arial, sans-serif; text-align: center; padding:3px 10px; border-bottom:solid 1px #d8d8d8" | Coordinates of bus stops in WGS84 coordinate system are provided with the location_id of each bus stops and the date of entry when the data is entered into the database. The more recent the data depicts a more updated record. | ||
| + | | style="font-family:Open Sans, Arial, sans-serif; text-align: center; padding:3px 10px; border-bottom:solid 1px #d8d8d8" | 4903 | ||
| + | |||
| + | |- | ||
| + | | style="font-family:Open Sans, Arial, sans-serif; text-align: center; padding:3px 10px; border-bottom:solid 1px #d8d8d8" | <strong>location _mapping</strong> | ||
| + | | style="font-family:Open Sans, Arial, sans-serif; text-align: center; padding:3px 10px; border-bottom:solid 1px #d8d8d8" | Names of each MRT stations and bus stops are provided together with the location_id. Date of entry of data when entered into the database is provided. The more recent the data depicts a more updated record. | ||
| + | | style="font-family:Open Sans, Arial, sans-serif; text-align: center; padding:3px 10px; border-bottom:solid 1px #d8d8d8" | 5070 | ||
| + | |||
| + | |- | ||
| + | | style="font-family:Open Sans, Arial, sans-serif; text-align: center; padding:3px 10px; border-bottom:solid 1px #d8d8d8" | <strong>ride_data_20120109_20120115</strong> | ||
| + | | style="font-family:Open Sans, Arial, sans-serif; text-align: center; padding:3px 10px; border-bottom:solid 1px #d8d8d8" | Ez-link transactions of commuters of all types of commuters category from 9 Jan 2012 to 15 Jan 2012. Each transactions displays the tap-in and top-out of ez-link card. | ||
| + | | style="font-family:Open Sans, Arial, sans-serif; text-align: center; padding:3px 10px; border-bottom:solid 1px #d8d8d8" | Millions | ||
| + | |} | ||
| + | </center> | ||
</div> | </div> | ||
| − | ==<div style="font-family:Open Sans, Arial, sans-serif; background: #ffffff; padding: 17px; line-height: 0.1em; text-indent: 10px; font-size:17px; border-left:8px solid #0091b3"><font color= #000000><strong> | + | ==<div style="background: #ffffff; padding: 17px; line-height: 0.1em; text-indent: 10px; font-size:17px; font-family: Helvetica; border-left:8px solid #0091b3"><font color= #000000><strong>Anomalies and Data Cleaning</strong></font></div>== |
| + | <div style="margin:0px; padding: 10px; background: #f2f4f4; font-family: Open Sans, Arial, sans-serif; border-radius: 7px; text-align:left"> | ||
| + | |||
| + | === Bus_service _mapping === | ||
| + | <center> | ||
| + | {| style="background-color:#ffffff ; margin: 3px 10px 3px 10px; font-size:15px" width="65%" | ||
| + | |- style="background:#f2f4f4; font-size:17px" | ||
| + | |||
| + | |- | ||
| + | | style="font-family:Open Sans, Arial, sans-serif; text-align: center; padding:3px 10px; border-bottom:solid 1px #d8d8d8" | [[File:TeamCommute-Bus_service_mapping1.png|250px]] | ||
| + | ''An example of a record with duplicated entries of different entry_date'' | ||
| + | | style="font-family:Open Sans, Arial, sans-serif; text-align: center; padding:3px 10px; border-bottom:solid 1px #d8d8d8" | [[File:TeamCommute-Bus_service_mapping2.png|250px]] | ||
| + | ''Final set of data where duplicates are removed with the most recent entry_date'' | ||
| + | |||
| + | |} | ||
| + | </center> | ||
| + | |||
| + | Upon retrieving the data from the database, there was a total of 29522 records. However, the large number of records were attributed to duplicates of records where new entry of bus service mapping is entered with the date where data is stored in the database. To remove duplicates, dates are sorted according to the most recent dates first followed by the later dates. There are 335 unique records after removing the duplicates. | ||
| + | |||
| + | |||
| + | SQL statement used for retrieving the data: | ||
| + | ''SELECT * FROM lta_ride_data_anly482.bus_service_mapping;'' | ||
| + | |||
| + | |||
| + | After cleaning the data, an additional step to sieve out relevant bus stops is required. As our analysis aims to identify the commuters’ behaviour when travelling inter-town, intra-town and island wide, we needed to sieve out bus stops that are within the former three mentioned. Intra town refers to commuters travelling within Tampines planning area; inter town refers to commuters travelling to neighbouring planning areas such as Paya Lebar, Pasir Ris, Bedok and Changi; island wide refers to commuters travelling outside of the east region. With that, using QGIS, we uploaded the bus stop data and clipped it with URA’s subzone shapefile. The bus stop data is then filtered accordingly as shown below. | ||
| + | |||
| + | <center> | ||
| + | {| style="background-color:#ffffff ; margin: 3px 10px 3px 10px; font-size:15px" width="80%" | ||
| + | |- style="background:#f2f4f4; font-size:17px" | ||
| + | |||
| + | |- | ||
| + | | style="font-family:Open Sans, Arial, sans-serif; font-size:16px; text-align: center; padding:5px; border-bottom:solid #0091b3" | | ||
| + | | style="font-family:Open Sans, Arial, sans-serif; font-size:16px; text-align: center; padding:5px; border-bottom:solid #0091b3" | <font color="#3c3c3c"><strong>Planning Area(s):</strong></font> | ||
| + | |||
| + | |- | ||
| + | | style="font-family:Open Sans, Arial, sans-serif; text-align: center; padding:3px 10px; border-bottom:solid 1px #d8d8d8" | [[File:TeamCommute_TAMP.png|250px]] <br> <i>Intra town bus stops</i> | ||
| + | | style="font-family:Open Sans, Arial, sans-serif; text-align: center; padding:3px 10px; border-bottom:solid 1px #d8d8d8" | Tampines | ||
| + | |||
| + | |- | ||
| + | | style="font-family:Open Sans, Arial, sans-serif; text-align: center; padding:3px 10px; border-bottom:solid 1px #d8d8d8" | [[File:TeamCommute_East.png|250px]] <br> <i>Inter town bus stops </i> | ||
| + | | style="font-family:Open Sans, Arial, sans-serif; text-align: center; padding:3px 10px; border-bottom:solid 1px #d8d8d8" | Paya Lebar, Bedok, Pasir Ris, Changi, Changi Bay | ||
| + | |||
| + | |- | ||
| + | | style="font-family:Open Sans, Arial, sans-serif; text-align: center; padding:3px 10px; border-bottom:solid 1px #d8d8d8" | [[File:TeamCommute_ISLANDW.png|250px]] <br> <i>Island wide bus stops </i> | ||
| + | | style="font-family:Open Sans, Arial, sans-serif; text-align: center; padding:3px 10px; border-bottom:solid 1px #d8d8d8" | Ang Mo Kio, Bishan, Boon Lay, Bukit Batok, Bukit Merah, Bukit Panjang, Bukit Timah, Central Water Catchment, Choa Chu Kang, Clementi, Downtown Core, Geylang, Hougang, Jurong East, Jurong West, Kallang, Lim Chu Kang, Mandai, Marina East, Marina South, Marine Parade, Museum, Newton, Novena, Orchard, Outram, Pioneer, Punggol, Queenstown, River Valley, Rochor, Seletar, Sengkang, Serangoon, Singapore River, Simpang, Sungei Kadut, Straits View, Tanglin, Tengah, Toa Payoh, Tuas, Western Water Catchment, Woodlands, Yishun | ||
| + | |||
| + | |} | ||
| + | </center> | ||
| + | |||
| + | === Location_gis_mapping === | ||
| + | <center> | ||
| + | {| style="background-color:#ffffff ; margin: 3px 10px 3px 10px; font-size:15px" width="80%" | ||
| + | |- style="background:#f2f4f4; font-size:17px" | ||
| + | |||
| + | |- | ||
| + | | style="font-family:Open Sans, Arial, sans-serif; text-align: center; padding:3px 10px; border-bottom:solid 1px #d8d8d8" | [[File:TeamCommute-loc_gis1.png|250px]] | ||
| + | ''An example of a record with duplicated entries of different entry_date'' | ||
| + | | style="font-family:Open Sans, Arial, sans-serif; text-align: center; padding:3px 10px; border-bottom:solid 1px #d8d8d8" |[[File:TeamCommute-loc_gis2.png|250px]] | ||
| + | ''Records with (0,0) coordinates are removed'' | ||
| + | | style="font-family:Open Sans, Arial, sans-serif; text-align: center; padding:3px 10px; border-bottom:solid 1px #d8d8d8" | [[File:TeamCommute-loc_gis3.png|250px]] | ||
| + | ''Final set of data with SVY21 coordinates where duplicates are removed with the most recent entry_date'' | ||
| + | |} | ||
| + | </center> | ||
| + | |||
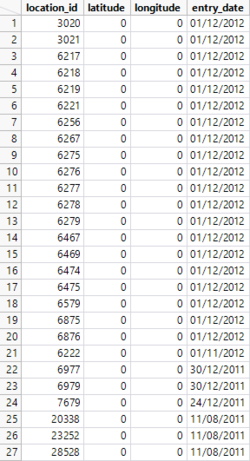
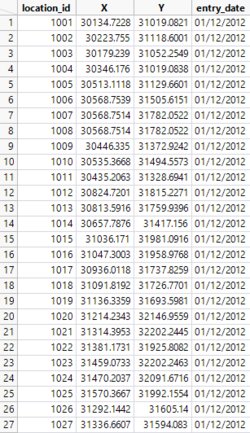
| + | Just like bus_service_mapping, location_gis_mapping data also has duplicated entries of the same location_id but with different entry_date. There are 442458 records upon retrieving this data. There is a total of records upon retrieving this data set from the database. After removing duplicates that has the older entry_dates, there is a total of 4903 records. | ||
| + | |||
| + | |||
| + | There are 27 records that have (0,0) as the coordinates. This appears to be an anomaly because these coordinates do not fit into the coordinates of Singapore island. With that, these records are also removed from the data for this project. As such, ez-link records in ride_data_20120109_20120115 with these location_ids are also removed since this will not help in the analysis of commuters’ patterns. | ||
| + | |||
| + | |||
| + | SQL statement used for retrieving the data: | ||
| + | ''SELECT * FROM lta_ride_data_anly482.location_gis_mapping;'' | ||
| + | |||
| + | === Location_mapping === | ||
| + | <center> | ||
| + | {| style="background-color:#ffffff ; margin: 3px 10px 3px 10px; font-size:15px" width="65%" | ||
| + | |- style="background:#f2f4f4; font-size:17px" | ||
| + | |||
| + | |- | ||
| + | | style="font-family:Open Sans, Arial, sans-serif; text-align: center; padding:3px 10px; border-bottom:solid 1px #d8d8d8" | [[File:TeamCommute-Bus_stop1.png|250px]] | ||
| + | ''An example of a record with duplicated entries of different entry_date'' | ||
| + | | style="font-family:Open Sans, Arial, sans-serif; text-align: center; padding:3px 10px; border-bottom:solid 1px #d8d8d8" |[[File:TeamCommute-Bus_stop2.png|250px]] | ||
| + | ''Final set of data where duplicates are removed with the most recent entry_date'' | ||
| + | |} | ||
| + | </center> | ||
| + | |||
| + | Just like bus_service_mapping and location_gis_mapping, location_mapping data also has duplicated entries of the same location_id but with different entry_date. There are 454310 records upon retrieving the data from database. After removing duplicates that has the older entry_dates, there is a total of 5070 records. | ||
| + | |||
| + | |||
| + | SQL statement used for retrieving the data: <i>SELECT * FROM lta_ride_data_anly482.location_mapping;</i> | ||
| + | |||
| + | === Ride_data_20120109_20120115 === | ||
| + | There are 41462837 records before cleaning the data. Given the large data size, retrieving the entire data regardless of commuter category (i.e. senior citizen, adult and student) will take an extremely long time for the database to load completely. As such, retrieval of data is done in batches per day for each commuter category. Any anomaly in the data is also removed with the use of SQL. | ||
| + | |||
| + | <center> | ||
| + | [[File:TeamCommute-adult.png|800px]]<br> | ||
| + | <i>Snapshot of ez-link data for adults before cleaning</i> | ||
| + | |||
| + | |||
| + | [[File:TeamCommute-elderly.png|800px]]<br> | ||
| + | <i>Snapshot of ez-link data for elderly before cleaning</i> | ||
| + | |||
| + | |||
| + | [[File:TeamCommute-student.png|800px]]<br> | ||
| + | <i>Snapshot of ez-link data for students before cleaning</i> | ||
| + | </center> | ||
| + | SQL statement used for retrieving the data of a batch: <i>SELECT * FROM lta_ride_data_anly482.location_gis_mapping WHERE commuter_category = “adult” AND destination_location_id <> -99 AND entry_date = ”09/01/2012”;</i> | ||
| + | |||
| + | ==== a. Discrepancies in data ==== | ||
| + | <center>[[File:TeamCommute-Discrepancies1.png|800px]]</center> | ||
| + | Ez-link transactions where commuters tap in but do not tap out. As such, “?” is reflected on exit_date, exit_time, exit_bus_service_direction and travelling_time; as well as, an undefined value of -99 for destination_location_id. These records are removed as they do not aid in the analysis. | ||
| + | |||
| + | |||
| + | <center>[[File:TeamCommute-Discrepancies2.png|800px]]</center> | ||
| + | RTS represents Rapid Transit System. These transactions reflects on commuters who travel by trains. As the bus service does not apply to RTS, an undefined value of “?” is reflected on bus_service, entry_bus_service and exit_bus_service. This set of data is only used when identifying multi-mode travellers for further analysis which will be touched on further in this report. | ||
| + | |||
| + | ==== b. Same origin and destination points ==== | ||
| + | <center>[[File:TeamCommute-origdest.png|800px]]</center> | ||
| + | There are transactions with same origin and destination points on the same day. These data do not benefit in this project’s analysis where we aim to identify the common points of interest that commuters travel to. As such, these data are removed. | ||
| + | |||
| + | ==== c. Negative travelling time ==== | ||
| + | <center>[[File:TeamCommute-negative.png|800px]]</center> | ||
| + | Using the elderly data and after exploring the distribution for travelling_time, there are 4 records where the elderly, of the same card holder, travelled with negative timings. As the entry and exit times are recorded for these records in the green box, the value for travelling time is updated by calculating the difference between the exit and entry times. However, the option to calculate the difference between the exit and entry time is not appropriate for the first two records. These records have entry time starting at noon but ended at 11:51:55am on the same day. It is likely that there is an error for these records as the values for all fields are very similar. As such, the records in the red box are deleted from the data. | ||
| + | |||
| + | ==== d. Undefined distance travelled ==== | ||
| + | <center>[[File:TeamCommute-undef.png|800px]]</center> | ||
| + | There are records with undefined distance travelled despite having the origin and destination ids. Distance travelled between these origins and destinations can be calculated through the use of QGIS where points are snapped together with the bus routes. However, there are only 87 of such records, from the elderly data, reflecting on the minority size corresponding to the entire data set with more than a million records, these records are deleted from the data. Same actions are made in similar situations for both the adult and student data. | ||
| + | |||
| + | ==== e. Multiple transactions from a single card user ==== | ||
| + | <center>[[File:TeamCommute-multitran.png|800px]]</center> | ||
| + | There was a card number with large number of similar transactions of at least 348,000 ez-link bus trip transactions over one week. Hence, we concluded that this could be due to an error in the system, and as such, this data that corresponds with this specific card number is deleted. | ||
| + | |||
| + | === Recommendations === | ||
| + | Demand for accurate and reliable transportation data is of utmost importance. The quality of data impacts every decision made by the data analysts. Ensuring the reliability and integrity of transportation data begins with the accuracy and the completeness of the data captured in the database. Anomalies surfaced are possibly due to technical errors observed. This seems to suggests that the maintenance of proper Ez-link records is not highly complied with by Ez-link. As Ez-link is not obliged to have the data cleaned before sending it to the relevant users, it is important for future analysts,who will be working on this same set of data,not to assume that the datasets that they received are cleaned. They need to have the data properly cleaned before applying the various analysis techniques to uncover insights from this data. | ||
| + | |||
| + | </div> | ||
| + | |||
| + | ==<div style="background: #ffffff; padding: 17px; line-height: 0.1em; text-indent: 10px; font-size:17px; font-family: Helvetica; border-left:8px solid #0091b3"><font color= #000000><strong>Aggregating Data</strong></font></div>== | ||
| + | <div style="margin:0px; padding: 10px; background: #f2f4f4; font-family: Open Sans, Arial, sans-serif; border-radius: 7px; text-align:left"> | ||
| + | |||
| + | === a. 15 minutes interval === | ||
| + | <center>[[File:TeamCommute-15min.png|800px]]</center> | ||
| + | Time of tap in and tap out for each transactions are in the lowest granular format (HH:MM:SS). It will be tedious to observe the pattern of travel if analysis are done by seconds. A bigger picture can only be observed when timings are grouped. As such, we aggregated the times for tap in and tap out to 15 minutes intervals (HH:00:SS, HH:15:SS, HH:30:SS, and HH:45:SS). Aggregation is done using jmp formula: <i>Round(:entry_time / (60 * 15)) * (60 * 15)</i>. | ||
| + | |||
| + | === b. Frequently travelled routes === | ||
| + | <center>[[File:TeamCommute-freq.png|800px]]</center> | ||
| + | To identify the frequently travelled routes each commuters travel to, a concatenation of the card_number, origin_id and destination_id will be performed first. Concatenation is done using jmp formula: <i>Card number||Char(Origin ID)||Char(Destination ID)</i>. Only the card number, origin and destination points are considered because our analysis revolves identifying the common points each commuter boards and alights the bus. Bus services are not considered because we are neither focusing on bus route optimization nor conducting a comparison between pedestrian network distance with bus travelled distance. To count the number of concatenated strings, this formula was used: <i>ColNumber(Row(), name of the col that has the concatenated strings)</i>. | ||
| − | |||
| − | |||
</div> | </div> | ||
Latest revision as of 10:34, 17 April 2016
Contents
Main Data Sets
| Name of Data | Nature of Data | Number of Records (after cleaning) |
| bus_service_mapping | The actual bus service numbers are provided alongside with the bus service ids together with the date of entry of data into the database. The more recent the data depicts a more updated record. | 335 |
| location_gis_mapping | Coordinates of bus stops in WGS84 coordinate system are provided with the location_id of each bus stops and the date of entry when the data is entered into the database. The more recent the data depicts a more updated record. | 4903 |
| location _mapping | Names of each MRT stations and bus stops are provided together with the location_id. Date of entry of data when entered into the database is provided. The more recent the data depicts a more updated record. | 5070 |
| ride_data_20120109_20120115 | Ez-link transactions of commuters of all types of commuters category from 9 Jan 2012 to 15 Jan 2012. Each transactions displays the tap-in and top-out of ez-link card. | Millions |
Anomalies and Data Cleaning
Bus_service _mapping
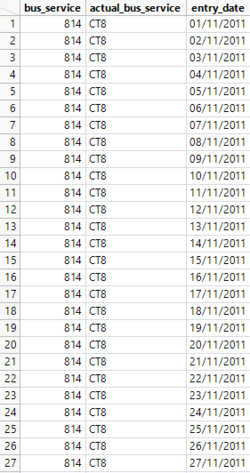
An example of a record with duplicated entries of different entry_date |
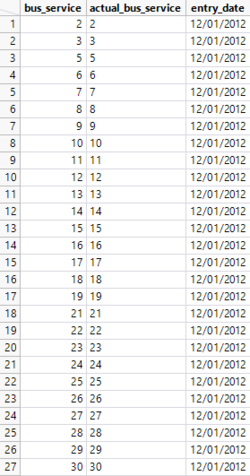
Final set of data where duplicates are removed with the most recent entry_date |
Upon retrieving the data from the database, there was a total of 29522 records. However, the large number of records were attributed to duplicates of records where new entry of bus service mapping is entered with the date where data is stored in the database. To remove duplicates, dates are sorted according to the most recent dates first followed by the later dates. There are 335 unique records after removing the duplicates.
SQL statement used for retrieving the data:
SELECT * FROM lta_ride_data_anly482.bus_service_mapping;
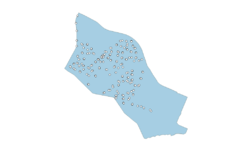
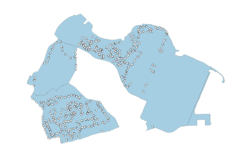
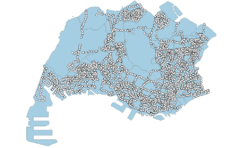
After cleaning the data, an additional step to sieve out relevant bus stops is required. As our analysis aims to identify the commuters’ behaviour when travelling inter-town, intra-town and island wide, we needed to sieve out bus stops that are within the former three mentioned. Intra town refers to commuters travelling within Tampines planning area; inter town refers to commuters travelling to neighbouring planning areas such as Paya Lebar, Pasir Ris, Bedok and Changi; island wide refers to commuters travelling outside of the east region. With that, using QGIS, we uploaded the bus stop data and clipped it with URA’s subzone shapefile. The bus stop data is then filtered accordingly as shown below.
Location_gis_mapping
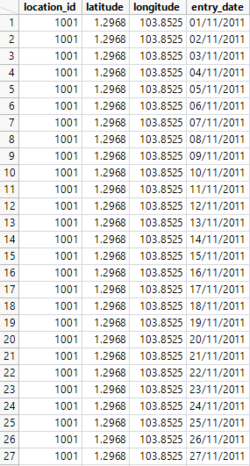
Just like bus_service_mapping, location_gis_mapping data also has duplicated entries of the same location_id but with different entry_date. There are 442458 records upon retrieving this data. There is a total of records upon retrieving this data set from the database. After removing duplicates that has the older entry_dates, there is a total of 4903 records.
There are 27 records that have (0,0) as the coordinates. This appears to be an anomaly because these coordinates do not fit into the coordinates of Singapore island. With that, these records are also removed from the data for this project. As such, ez-link records in ride_data_20120109_20120115 with these location_ids are also removed since this will not help in the analysis of commuters’ patterns.
SQL statement used for retrieving the data:
SELECT * FROM lta_ride_data_anly482.location_gis_mapping;
Location_mapping
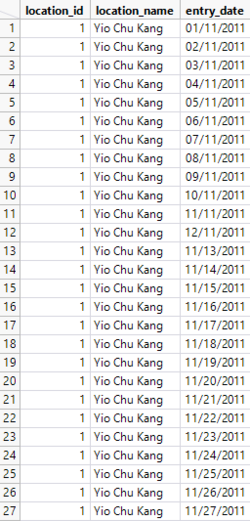
An example of a record with duplicated entries of different entry_date |
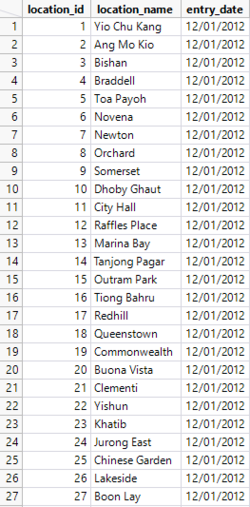
Final set of data where duplicates are removed with the most recent entry_date |
Just like bus_service_mapping and location_gis_mapping, location_mapping data also has duplicated entries of the same location_id but with different entry_date. There are 454310 records upon retrieving the data from database. After removing duplicates that has the older entry_dates, there is a total of 5070 records.
SQL statement used for retrieving the data: SELECT * FROM lta_ride_data_anly482.location_mapping;
Ride_data_20120109_20120115
There are 41462837 records before cleaning the data. Given the large data size, retrieving the entire data regardless of commuter category (i.e. senior citizen, adult and student) will take an extremely long time for the database to load completely. As such, retrieval of data is done in batches per day for each commuter category. Any anomaly in the data is also removed with the use of SQL.

Snapshot of ez-link data for adults before cleaning
SQL statement used for retrieving the data of a batch: SELECT * FROM lta_ride_data_anly482.location_gis_mapping WHERE commuter_category = “adult” AND destination_location_id <> -99 AND entry_date = ”09/01/2012”;
a. Discrepancies in data

Ez-link transactions where commuters tap in but do not tap out. As such, “?” is reflected on exit_date, exit_time, exit_bus_service_direction and travelling_time; as well as, an undefined value of -99 for destination_location_id. These records are removed as they do not aid in the analysis.

RTS represents Rapid Transit System. These transactions reflects on commuters who travel by trains. As the bus service does not apply to RTS, an undefined value of “?” is reflected on bus_service, entry_bus_service and exit_bus_service. This set of data is only used when identifying multi-mode travellers for further analysis which will be touched on further in this report.
b. Same origin and destination points

There are transactions with same origin and destination points on the same day. These data do not benefit in this project’s analysis where we aim to identify the common points of interest that commuters travel to. As such, these data are removed.
c. Negative travelling time

Using the elderly data and after exploring the distribution for travelling_time, there are 4 records where the elderly, of the same card holder, travelled with negative timings. As the entry and exit times are recorded for these records in the green box, the value for travelling time is updated by calculating the difference between the exit and entry times. However, the option to calculate the difference between the exit and entry time is not appropriate for the first two records. These records have entry time starting at noon but ended at 11:51:55am on the same day. It is likely that there is an error for these records as the values for all fields are very similar. As such, the records in the red box are deleted from the data.
d. Undefined distance travelled

There are records with undefined distance travelled despite having the origin and destination ids. Distance travelled between these origins and destinations can be calculated through the use of QGIS where points are snapped together with the bus routes. However, there are only 87 of such records, from the elderly data, reflecting on the minority size corresponding to the entire data set with more than a million records, these records are deleted from the data. Same actions are made in similar situations for both the adult and student data.
e. Multiple transactions from a single card user

There was a card number with large number of similar transactions of at least 348,000 ez-link bus trip transactions over one week. Hence, we concluded that this could be due to an error in the system, and as such, this data that corresponds with this specific card number is deleted.
Recommendations
Demand for accurate and reliable transportation data is of utmost importance. The quality of data impacts every decision made by the data analysts. Ensuring the reliability and integrity of transportation data begins with the accuracy and the completeness of the data captured in the database. Anomalies surfaced are possibly due to technical errors observed. This seems to suggests that the maintenance of proper Ez-link records is not highly complied with by Ez-link. As Ez-link is not obliged to have the data cleaned before sending it to the relevant users, it is important for future analysts,who will be working on this same set of data,not to assume that the datasets that they received are cleaned. They need to have the data properly cleaned before applying the various analysis techniques to uncover insights from this data.
Aggregating Data
a. 15 minutes interval

Time of tap in and tap out for each transactions are in the lowest granular format (HH:MM:SS). It will be tedious to observe the pattern of travel if analysis are done by seconds. A bigger picture can only be observed when timings are grouped. As such, we aggregated the times for tap in and tap out to 15 minutes intervals (HH:00:SS, HH:15:SS, HH:30:SS, and HH:45:SS). Aggregation is done using jmp formula: Round(:entry_time / (60 * 15)) * (60 * 15).
b. Frequently travelled routes

To identify the frequently travelled routes each commuters travel to, a concatenation of the card_number, origin_id and destination_id will be performed first. Concatenation is done using jmp formula: Card number||Char(Origin ID)||Char(Destination ID). Only the card number, origin and destination points are considered because our analysis revolves identifying the common points each commuter boards and alights the bus. Bus services are not considered because we are neither focusing on bus route optimization nor conducting a comparison between pedestrian network distance with bus travelled distance. To count the number of concatenated strings, this formula was used: ColNumber(Row(), name of the col that has the concatenated strings).

