Difference between revisions of "AY1516 T2 Team CommuteThere Project Further Analysis"
| Line 166: | Line 166: | ||
Using Hub Lines, a function in MMQGIS plugin of QGIS as mentioned in the methodology of this project, straight lines are connected between the origins and destinations. This provides a better visualization of the approximate length between each connecting points; as well as where are the origins connecting to the common destinations. Only neighbourhood hubs are used as a focal point for this analysis because these are places where elderly would likely mingle with each other given the familiarity in the neighbourhood. | Using Hub Lines, a function in MMQGIS plugin of QGIS as mentioned in the methodology of this project, straight lines are connected between the origins and destinations. This provides a better visualization of the approximate length between each connecting points; as well as where are the origins connecting to the common destinations. Only neighbourhood hubs are used as a focal point for this analysis because these are places where elderly would likely mingle with each other given the familiarity in the neighbourhood. | ||
| − | ( | + | <center> |
| + | {| style="background-color:#ffffff ; margin: 3px 10px 3px 10px; font-size:15px" width="60%" | ||
| + | |- style="background:#f2f4f4; font-size:17px" | ||
| + | |||
| + | |- | ||
| + | | style="font-family:Open Sans, Arial, sans-serif; font-size:16px; text-align: center; padding:5px; border-bottom:solid #0091b3" | | ||
| + | | style="font-family:Open Sans, Arial, sans-serif; font-size:16px; text-align: center; padding:5px; border-bottom:solid #0091b3" | <font color="#3c3c3c"><strong>Hub A</strong></font> | ||
| + | | style="font-family:Open Sans, Arial, sans-serif; font-size:16px; text-align: center; padding:5px; border-bottom:solid #0091b3" | <font color="#3c3c3c"><strong>Hub B</strong></font> | ||
| + | | style="font-family:Open Sans, Arial, sans-serif; font-size:16px; text-align: center; padding:5px; border-bottom:solid #0091b3" | <font color="#3c3c3c"><strong>Hub C</strong></font> | ||
| + | |||
| + | |- | ||
| + | | style="font-family:Open Sans, Arial, sans-serif; text-align: center; padding:3px 10px; border-bottom:solid 1px #d8d8d8" | <strong>Average time (hours)</strong> | ||
| + | | style="font-family:Open Sans, Arial, sans-serif; text-align: center; padding:3px 10px; border-bottom:solid 1px #d8d8d8" | 3.67 | ||
| + | | style="font-family:Open Sans, Arial, sans-serif; text-align: center; padding:3px 10px; border-bottom:solid 1px #d8d8d8" | 3.14 | ||
| + | | style="font-family:Open Sans, Arial, sans-serif; text-align: center; padding:3px 10px; border-bottom:solid 1px #d8d8d8" | 5.67 | ||
| + | |||
| + | |- | ||
| + | | style="font-family:Open Sans, Arial, sans-serif; text-align: center; padding:3px 10px; border-bottom:solid 1px #d8d8d8" | <strong>Median time (hours)</strong> | ||
| + | | style="font-family:Open Sans, Arial, sans-serif; text-align: center; padding:3px 10px; border-bottom:solid 1px #d8d8d8" | 1.51 | ||
| + | | style="font-family:Open Sans, Arial, sans-serif; text-align: center; padding:3px 10px; border-bottom:solid 1px #d8d8d8" | 1.13 | ||
| + | | style="font-family:Open Sans, Arial, sans-serif; text-align: center; padding:3px 10px; border-bottom:solid 1px #d8d8d8" | 4.37 | ||
| + | |||
| + | |} | ||
| + | </center> | ||
| + | |||
Elderly spend about 1-4 hours for all hubs. The average hours differ a lot from the median hours especially for hubs A and B. An assumption could be that there are elderly who live at these areas and then travel to other places. Nevertheless, elderly who frequently travel to these hubs spend a relatively long period of time at these hubs. | Elderly spend about 1-4 hours for all hubs. The average hours differ a lot from the median hours especially for hubs A and B. An assumption could be that there are elderly who live at these areas and then travel to other places. Nevertheless, elderly who frequently travel to these hubs spend a relatively long period of time at these hubs. | ||
====Neighbourhood Hub A==== | ====Neighbourhood Hub A==== | ||
Revision as of 09:45, 17 April 2016
Contents
Adult
Multimodal Transportation Patterns
Multi-mode commuters consist of commuters who change modes of transport, from one to another to get to their desired point of interest. As Tampines MRT and Simei MRT were the main destination points of commuters, we wanted to find out if these commuters were travelling to points of interest near the MRT stations, or if they were travelling to alternative destinations by utilising the train. As such, we utilised the ez-link data for commuters who travelled by train, to find out if the same commuters to travelled to the MRT station took MRT rides to their destinations.
By doing so, we found out that 44.3% of commuters who travel within Tampines during the morning peak period actually travel to Tampines MRT or Simei MRT, to use the train to get to their destination points.
This refutes the point of one of our earlier analysis conducted, whereby it was discovered that a majority of bus rides were made within Tampines itself. From this new finding, we have discovered that actually a bulk of commuters travel mostly to other parts of the country by utilising another mode of transport.
To look further into the travelling patterns of these commuters who utilised multi modes of transportation to get to their destination, we ran distributions of the distance travelled by train, and the travelling time by train.
From the distributions above, we can see that the average distance travelled by train is about 16.4km, and there was a distance decay index of 16.4. In addition, about 50% of the people travelled at least 16.8km to their destinations. As for the travelling time, the average travelling time is about 35.6 minutes, with 50% of the people travelling for at least 35.7 minutes to their destinations. From here, we can see that when the multi-mode commuters take trains, they are more likely to travel long distances away from tampines itself.
Also, we wanted to look at the bus commuting distributions for commuters who utilised multi-mode transportation. These distributions can be seen below.
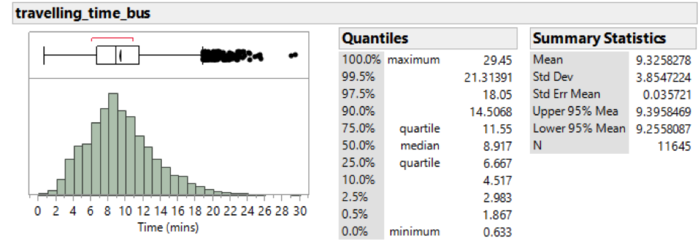
It was found that the average distance travelled by bus, by these multi-mode commuters, were about 1.79km. In addition, 50% of the people travelled distances of, or less than 1.7km. The average time taken to travel was around 9.32 minutes, with 50% of the commuters travelling for a period of less than 8.92 minutes. From these distributions, we can see that the distance travelled and time taken by multi-mode commuters who used the bus, is less than that of to the commuters who travelled similar routes in at least 4 days, during the morning peak hours, in Tampines. The difference, however, does not differ significantly. This can be seen in the table below.
| At Least 4 Trips | Multi Mode | |
| Average Distance (km) | 1.93 km | 1.79 km |
| Median Distance (km) | 1.80 km | 1.70 km |
| Average Time Taken (mins) | 9.49 mins | 9.32 mins |
| Median Time Taken (mins) | 8.93 mins | 8.92 mins |
Transfers
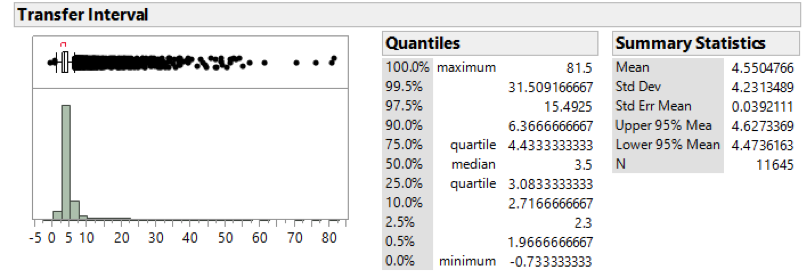
After which, we looked at the distribution of the time interval between exit timings of the first mode of transport and entry timings of the second mode of transport. This can be either from bus to MRT, or from MRT to bus. The distribution can be seen in the chart below.
From the distribution above, we can see that the average time taken for transfers of mode of transport is around 4.55 minutes. In fact, 90% of commuters are able to get onto their second mode of transport within 6.4 minutes. As such, we can see that it is relatively feasible for adult commuters to change their modes of transport. In totality, we can assume that the average commuter takes about 45 minutes to get to their destination from Tampines itself. This is a relatively long period of time.
Common Destination Points
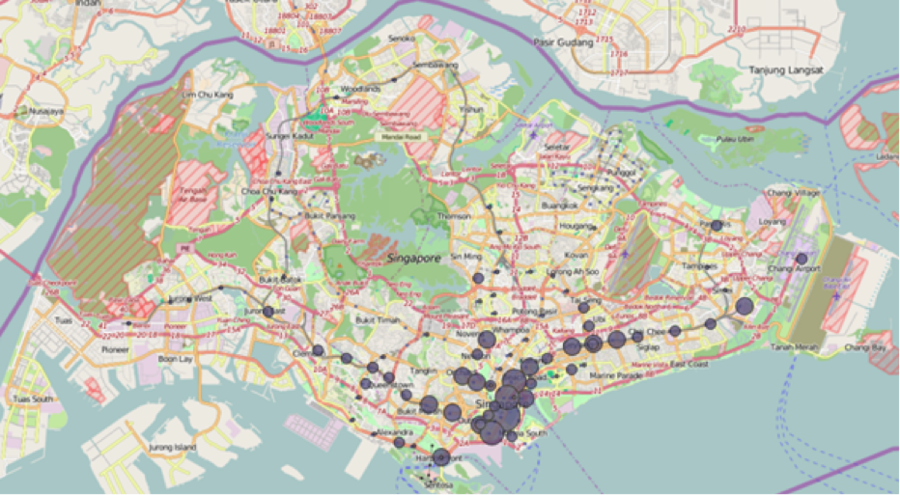
After finding out that adult commuters who travel out of tampines, during the morning peak hours have a higher propensity to travel long distances, we wanted to discover where these commuters were travelling to. Hence, we plotted the destination points of these commuters into QGIS, and the results can be seen below.
From the screenshot above, we can establish that most of these working adults are travelling to the CBD area and the nearby town area. Also, a majority of these commuters travel along the East-West line to get to their destination. Last but not least, there are some multi-modal commuters who travel to the red line itself, around the town area, and to other places such as Harbourfront.
To gain a better understanding of the exact travel patterns of these multi-modal commuters, we created an animation chart which can be seen below.
From this animation, we can see that at the beginning of the peak hour, most of these trips were made to other parts of the surrounding green lines. At 8 to 9 am, most of the commuters from Tampines reach their destinations at the town and CBD area. From here, we can conclude that the adults use multi-modal transportation during the peak hour to get to their offices. Most of the MRT stations that were frequented to, as highlighted in the diagram above are situated near offices.
Conclusion
In summary, what we have found was that the adult multi-modal commuters who travel during morning peak hours from Tampines are the ones who have a higher propensity to travel long distances by train to reach their destination. This is because they need to reach their destinations on time. As such, their point of interest is not in actual fact, Tampines MRT or Simei MRT, but their workplaces.
Recommendations
Based on our analysis above, we would like to propose a few recommendations.
1) Increase the frequency of buses
As we have seen from our analysis, the morning peak period of bus commuters is from 7am to 9am, and a significant number of commuters travel to the MRT stations to get to their desired destination. It is important to note that since a majority of them (90%) travel up to 2.7km to get to their destinations, encouraging walking may not be as feasible as it will take these commuters a longer amount of time to reach these MRT stations.
This would aid in their decision making process if they should increase the frequency of all bus services during morning peak periods or only selective ones. It might be possible for new bus services,that only operate during morning peak period and serve short distances,to be provided in Tampines to serve the needs of these commuters and ease the overcrowding problem during morning peak period.
As such, there can be more buses provided at this period in time, to meet the demands of these commuters as well. In addition, the greater frequency of buses can, and will encourage them to take public transport more often.
2) Revise current campaigns
There have been campaigns targeted at encouraging commuters to commute by train at an earlier time. There are currently campaigns such as Travel Smart Rewards, which provide incentives to commuters who travel before the peak hour begins, and to commuters who travel after the peak period ends. The current initiative requires commuters to tap out by 7.45 am, or to tap in after 9.00 am. However, as seen in our analysis, most of the commuters that utilise the train during peak hours only reach their offices at 8.30 am. Hence, the incentive may not be as strong, for commuters who stay at Tampines to leave their houses earlier to be able to tap out by 7.45 am, whereas commuters who stay nearer to their offices in the city area are able to benefit more from campaigns like these.
A suggestion would be to encourage commuters to leave their houses earlier, and perhaps require them to tap in before the time frame, instead of tapping out by 7.45 am. In this way, commuters who not only stay at Tampines, but also other parts of Singapore that are located far away from the city area, may not have much of an incentive to travel earlier. For example, commuters from tampines can be encouraged to tap in by 7.30 am, as they may take approximately half an hour to reach their destination.
Elderly
Multimodal Transportation Patterns
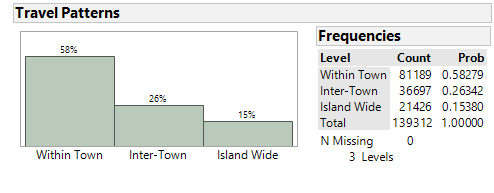
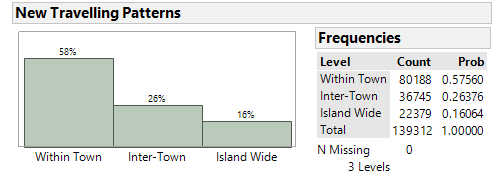
Given the large concentration of destination points at Tampines Hub as shown in the heatmap above, a multi-mode analysis is conducted to understand if travelling to the Tampines Hub meant that elderly would travel out of Tampines planning area. However, after merging the train data with the bus data, there is no big difference between the old and new travelling patterns where new travelling patterns takes into account the multi-mode analysis. There is an increase of 1% for “island wide” category but no percentile changes for both “within town” and “inter-town” categories. The increase of 1% could be attributed by the small shift of commuters from the next two categories. However, this analysis is done with an assumption that commuters will take the train after alighting from the bus.
Only a small percentage of 0.754% of the elderly population opted for multi-modal transportation during peak periods. This concludes that majority of the elderly still prefers to travel within Tampines planning area than to venture out of the town.
Transfers
Transfer from bus to MRT
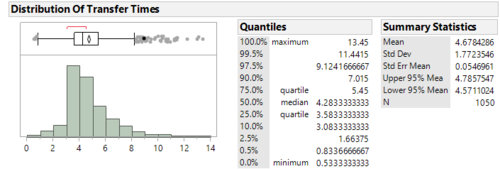
This chart shows the distribution of transfer times between bus stops to MRT. The average time taken for transfers is 4.68min while 50% of the transfers take less than 5min. 25% of the commuters took at most 3.60min to transfer.
Transfer from MRT to bus
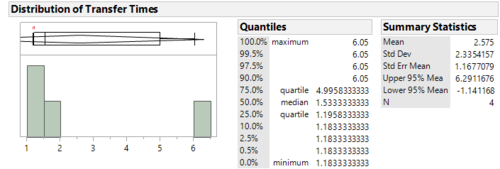
Unfortunately, there are only 4 transfers where commuters transfer from MRT to a bus stop. Due to the small data size, the distribution of transfer times do not show much insights. Nevertheless, the average transfer taken to transfer from a MRT station to bus stop takes about 2.58min while 50% of the transfers take less than 2min.
In conclusion, there are more elderly moving out of Tampines planning area than coming into Tampines. The short time taken for transfer could show either the efficiency of the bus services or bus stops are close to MRT stations, hence shorter time taken is required to arrive at the next mode of transport.
Preferential Hanging Out Places
Given the heatmap plotted out to identify what are the common popular destination for elderly, the next step is to analyse where do the commuters begin their journeys from. Doing so allows us to understand if distance do not matter to the elderly but the destination points matter; as well as, whether elderly commute by bus even for a short distance.
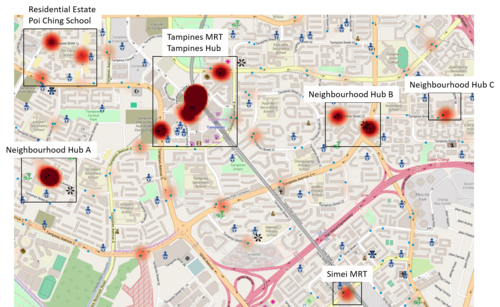
Using Hub Lines, a function in MMQGIS plugin of QGIS as mentioned in the methodology of this project, straight lines are connected between the origins and destinations. This provides a better visualization of the approximate length between each connecting points; as well as where are the origins connecting to the common destinations. Only neighbourhood hubs are used as a focal point for this analysis because these are places where elderly would likely mingle with each other given the familiarity in the neighbourhood.
| Hub A | Hub B | Hub C | |
| Average time (hours) | 3.67 | 3.14 | 5.67 |
| Median time (hours) | 1.51 | 1.13 | 4.37 |
Elderly spend about 1-4 hours for all hubs. The average hours differ a lot from the median hours especially for hubs A and B. An assumption could be that there are elderly who live at these areas and then travel to other places. Nevertheless, elderly who frequently travel to these hubs spend a relatively long period of time at these hubs.
Neighbourhood Hub A
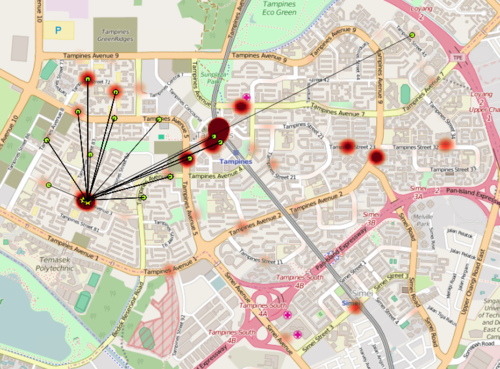
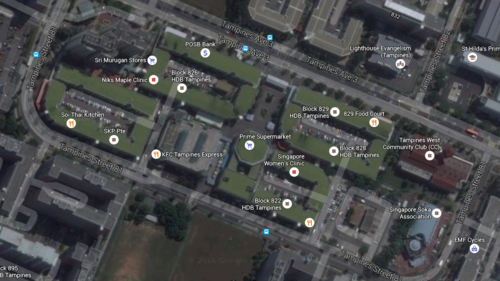
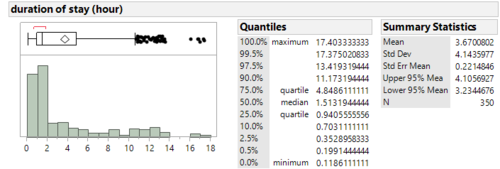
Elderly who travel to neighbourhood hub A tend to live near to this hub, except for an outlier that is situated far from the hub. On average, elderly spend 3.67 hours at the hub. However, it is incorrect to use this value to conclude that elderly spend 3.67 hours at the hub as there are elderly who spent way longer time that lengthened the average time where it could mean that some elderly live in this area too given that it is a commercial and residential land.
As such, the quantile values are used instead. Majority of the elderly spend about 1.5 hours at the hub.
Neighbourhood Hub B
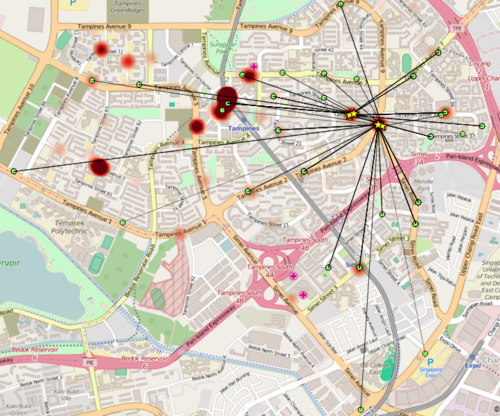
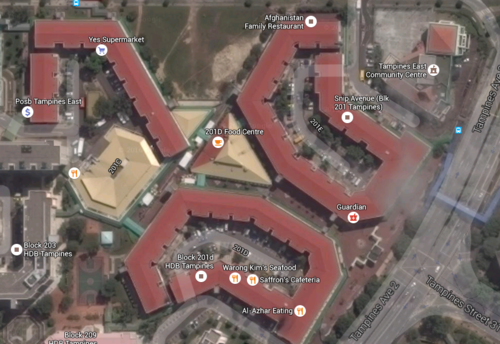
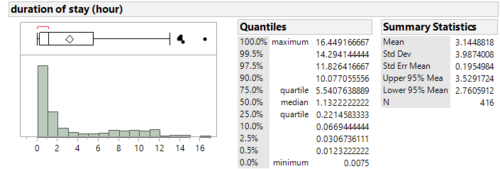
There are more elderly travelling to neighbourhood hub B compared to the other two hubs. This could be due to many eateries, food centre and grocery store situated at this hub. This also explains why regardless of the distance required to travel, elderly would travel to this hub. Majority of the elderly spend about 1.13 hours at this place, although on average, the average time spent is 3.15 hours.
Neighbourhood Hub C
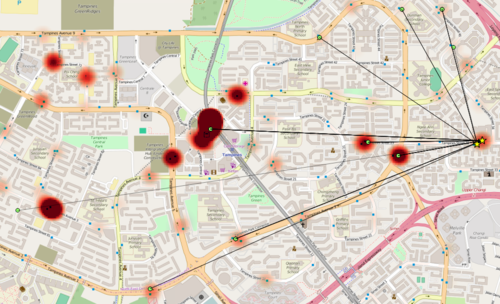
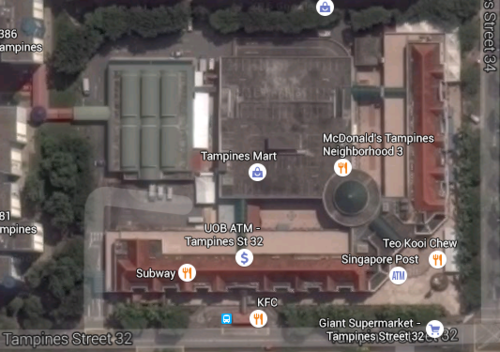
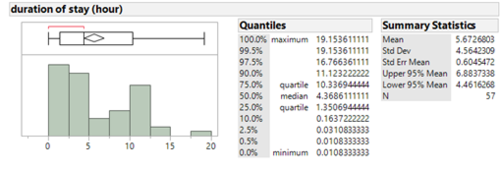
Neighbourhood hub C is smaller than the other two hubs but commuters would still travel to this hub regardless of the longer distance taken as shown on the map. Despite the smaller size of this hub compared to the other two hubs, elderly tend to spend a relatively longer time staying at this hub compared to rest. Majority of the elderly spend about 4.4 hours at this hub.
Recommendations
Having done a further analysis on the behaviour of the elderly and understanding their preferred hanging out places, planners and architects can look further into introducing more physical infrastructures to these hubs such as replacing stairs with slopes or adding for railings. Besides physical infrastructures, town council may consider lining up more elderly related activities since this is the period where elderly travel the most. Given that many elderly would travel to the neighbourhood hubs, interesting programs may be planned to entertain them. Having said that, we also recognise that the identified places are where most elderly travel to, thus neglecting the least popular places hence probably lesser elderly-friendly environment for them. Nonetheless, taking care of the popular places by introducing an environment suitable for the elderly first may eventually help to brighten the vibrancy of Tampines for the elderly.
Student
1. Distance Traveled for at Least 4 Trips Made During Morning Peak
|
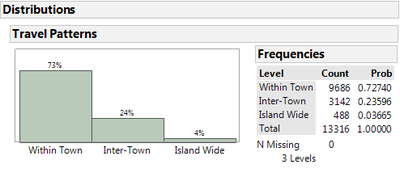
As can be seen from the bar chart above, most of the destinations are within Tampines Area and the nearby new town. 73% of the students who made at least 4 trips during that week are within Tampines New Town, whereas 24% of them travel to nearby new towns such as Bedok and 4% of them travel to other places that are not of close proximity to Tampines. This means that students who made at least 4 trips during that week is likely to travel short distance to school during morning peak hour.
|
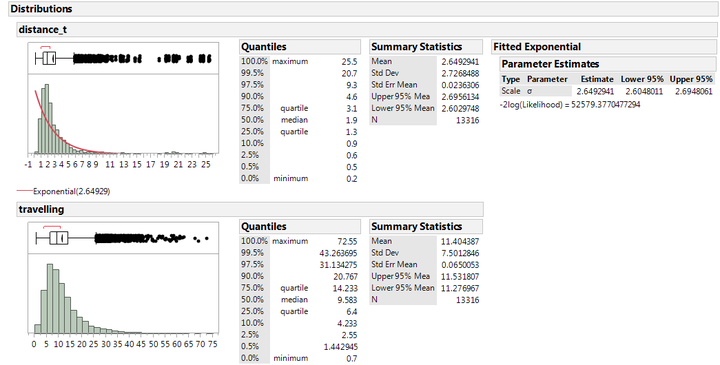
This can be further supported by the distribution above on the distance travelled for students who made at least 4 trips during that week. The distribution is right skewed with a distance decay index of 2.64. With reference to the overall distance decay index of 3.6 for students(as seen in Initial Analysis), students are less willing to travel a longer distance during morning peak period. 50% of the trips are less than 2km which means that 50% of the trips are completed within 10 minutes. On average, students travel 2.64km on weekdays to school which took them about 12 minutes to reach their destination.
2. Multimodal Transportation Patterns
2.1 Revised Travel Patterns
As seen from Initial Analysis, Simei and Tampines are two of the popular destinations during morning peak hour made by students who made the same trips for at least 4 times during a week. This suggests that some students might actually use multi modes of transportation to get to their destination. Thus, we made use of MRT data to further analyse how the distributions for travel patterns will change if multi modal transportation is taken into consideration.
 |
|
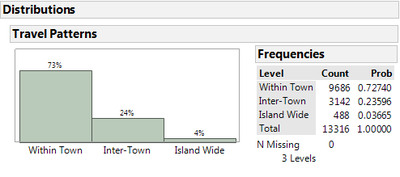
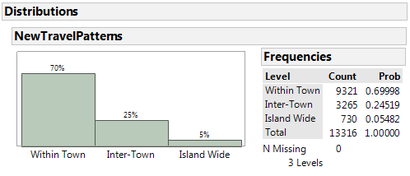
From the distribution above, The absolute count of within town trips has decreased from 9,686 to 9,516. On the other hand, absolute count for inter-town trips and island wide trips has increased from 3,142 to 3,222 and 488 to 579 respectively. However, the change in percentages are negligible and most of the trips made are still within Tampines New Town.
2.2 Transfers
As our multimodal transportation dataset consist of transfer made from (i) MRT/LRT to a bus service and (ii) bus service to MRT/LRT, we would like to help our sponsor to understand the efficiency of the current transportation system by looking at the amount of effort that the students have to make in order to transfer from one mode of transportation to another. Our group will be analysing the transfer interval of (MRT →Bus) and (Bus →MRT).
|
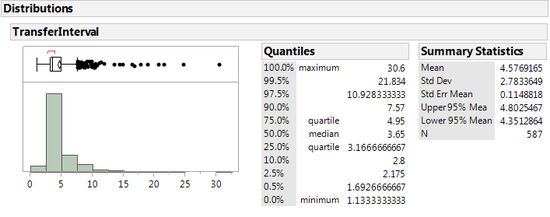
The distribution shows the overall transfer interval of students. On average, students took about 5 minutes to transfer from one mode of transportation to another mode of transportation with 90% of the students transiting within 10 minutes. Our group feels that this is a fairly reasonable transfer interval which indicates that our current transportation system is quite efficient.
2.2.1 MRT/LRT to Bus Service
|
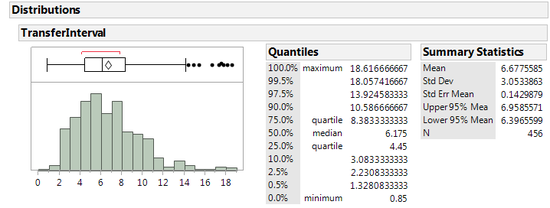
The distribution shows the transfer interval of students transferring from MRT to bus. On average, students took about 7 minutes to transfer with 90% of the students transiting within 10 minutes. This means that the bus interchange is of close proximity to the MRT. As the time interval takes into account the time taken for students to walk to the bus interchange and bus waiting time, we are able to deduce that the bus frequency in Tampines is quite high during morning peak period which lead to short bus waiting time. This enables students to be able to transfer from MRT to bus within 7 minutes.
2.2.2 Bus Service to MRT/LRT
|
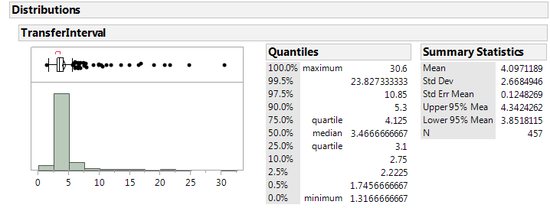
The distribution shows the transfer interval of students transferring from bus to MRT. On average, students took about 4 minutes to transfer with 90% of the students transiting within 5 minutes. This means that the MRT is of close proximity to the bus interchange which shows that minimum effort is required for students to transfer from Bus to MRT.
Comparing the transfer intervals of (i) and (ii), the transfer interval will be longer if the student is transferring from MRT to bus as compared to bus to MRT.
2.3 Least Cost Walk Path Analysis
2.3.1 Relationship Between Walking and Bus Transportation
Besides bus and MRT, walking is also a mode of transportation. The Singapore government recently introduced “Car Free Sunday SG” as part of their initiatives to shift Singapore towards a car-lite future so as to be more sustainable in the long run. Thus, we would like to help our sponsor to understand the relationship between walking and bus transportation.
|
Studies have shown that on average, people are willing to walk up till 400m. Furthermore, our group assumes that for the same destination,buses tend to travel a longer distance as compared to walking. Thus, this analysis will only consists of students who made at least 4 trips during the week and the distance traveled is less than or equal to 1km.
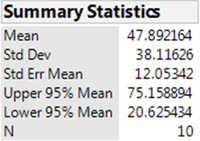
A comparison between 10 of the least cost paths constructed using the Traditional Method and using the Euclidean Distance method shows that on average, the Euclidean Distance method will underestimate the distance travelled by about 125m. [Error bound: 47.89+ 2* 38 ≈ 125m ]As our group will be using the Euclidean Distance method due to time constraint and therefore, 125m will be added to the distance calculated using the Euclidean Distance method.
A study conducted by a student in Portland State university shows that the average walking speed of young male and female is 4.96 and 4.73 feet per second respectively. Thus, we will made use of the average of these two speed which is 4.85 foot per second or 88.6 meter per minute for our analysis.
A report released by SBS transit shows that the waiting time for bus services during peak period is on average 15 mins. Since there are several initiatives,such as the bus service enhancement programme, to improve the bus service level in singapore, an average of 10mins waiting time will be used instead of 15 mins.
|
|
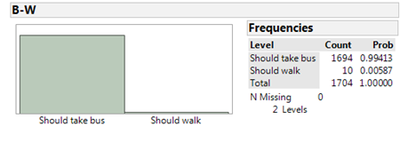
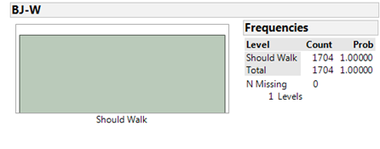
| Walking Time vs Bus Travel Time(Excluding Bus Waiting Time) | Walking Time vs Bus Travel Time(Including Bus Waiting Time) |
By comparing walking time and bus travel time(excluding bus waiting time), most of the students will prefer to take the bus since it is faster than walking as represented by “Should take bus”. Although there is a minority of students who might prefer to walk since walking time is shorter than bus travel time (i.e “should walk”), upon further analysis, the difference between the walking time and bus travel time is negligible. Thus, most of the students will prefer to take the bus.
By comparing walking time and bus travel time(including bus waiting time of 10mins), most of the students should prefer to walk since walking time is shorter than bus travel time. This means that if the bus frequency is high during morning peak period, this will reduce bus waiting time which will encourage students to take the bus instead of walking. If the bus frequency is low, the increased bus waiting time will discourage students to take the bus and they will choose to walk to school instead.
From our group’s findings, it seems to suggest that the bus frequency within Tampines area during morning peak hour is quite high and therefore the reduction in bus waiting time during morning peak hour discourage students from walking to school.
2.3.2 Recommendations
Based on our analysis, it seems to suggests that in order to encourage utilitarian walking among the students, the relevant bus companies would have to reduce the frequency of their buses during morning peak period as the short bus waiting time due to high bus frequency will discourage students to walk. However, our group recognise that it is not a politically wise decision to reduce the bus frequency during peak period in order to encourage students to walk as it might lead to public outcry since the other popular groups(i.e elderly and adult) are affected as well. By taking into account the impact of high bus service levels in Singapore on walkability of students, a multi-pronged approach is required to bring about behavioural changes among the students. There is unprecedented potential for cross-sector collaboration to work towards encouraging utilitarian walking among the students.
For example, the Ministry of Education (MOE) can partner with the Singapore Health Promotion Board to launch behavioural change campaigns in schools to encourage students,especially those who live near the school, to walk to school instead of taking a bus in a bid to ease the congestion problem during morning peak hour. MOE can also collaborate with the Urban Redevelopment Authority(URA) to hold discussion forums with the students in order for planners to understand how they can further improve current urban design policy in order to encourage students who live near the neighbourhood to walk to school.
3. Bus Stops Access Potential
3.1 Bus Stops Proximity to Schools
As we have established that students,who made at least 4 trips in a week, are traveling to school during morning peak hour and most of the trips made are within Tampines New Town, it is important for our sponsor to understand if the current transportation system meet the needs of these students by assessing if the bus stops that these students alight at are of close proximity to the school
|
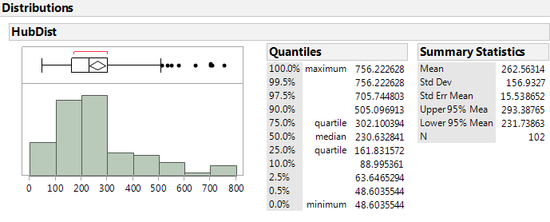
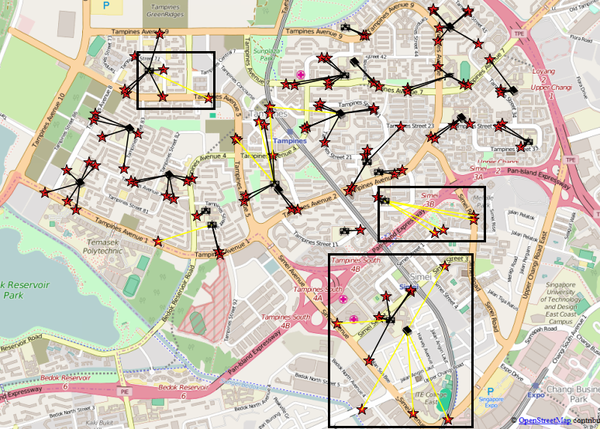
The distance from bus stops to the nearby schools are calculated using Hub Distance function from MMQGIS. From the Hub Distance distribution, on average, bus stops are 262 m away from schools and 75% of the bus stops are within 300m from schools. As research has shown that people,on average,are willing to walk up till 400m(Walker, 2011), the bus stops that students alighted at to go to school are moderately well located from school.
|
From OSM map, the bus stops that are more than 400m away from the schools are highlighted in yellow. Students who alighted near the Tampines Bus Interchange are assumed to be traveling out of Tampines New Town by transiting to MRT or other bus services. Thus, the bus stops around this area would not be of a concern to the planners.
Students who alighted near Temasek Polytechnic are assumed to be poly students as if they are primary school students who are going to the primary school that is assigned by QGIS, they would have alighted at the previous bus stop instead of the current one. Thus, this particular bus stop that is highlighted is not of a concern.
Therefore, the bus stops that are more than 400m away from the schools and are deemed to have low accessibility to schools are shown in the boxes.
3.2 Recommendations
Based on our earlier findings, bus stops that are more than 400m away from the school would require further analysis to understand the purpose of the students who alighted at these bus stops and whether they are actually going to the schools nearby. However, this is beyond the scope of our project. Assuming that the students are indeed going to the schools nearby, planners would have to look at the number of students affected and consider if they should relocate these bus stops nearer to the schools in order to better serve the needs of these students.


