Difference between revisions of "AY1516 T2 Team CommuteThere Project Initial Analysis"
| Line 43: | Line 43: | ||
<div style="margin:0px; padding: 10px; background: #f2f4f4; font-family: Open Sans, Arial, sans-serif; border-radius: 7px; text-align:left"> | <div style="margin:0px; padding: 10px; background: #f2f4f4; font-family: Open Sans, Arial, sans-serif; border-radius: 7px; text-align:left"> | ||
| − | |||
| − | |||
| − | |||
| − | |||
| − | |||
| − | |||
Revision as of 02:04, 17 April 2016
Contents
Flowchart of Process Taken for Initial Analysis
Island Wide Distribution
Distance Travelled
| Adult | Elderly | Student | |
| Average Distance (km) | 4.38 km | 4.50 km | 3.62 km |
| Median Distance (km) | 2.70 km | 2.80 km | 2.30 km |
| Distance Decay Index | 4.38 | 4.50 | 3.62 |
Adult
The average distance travelled for a bus ride is 4.38km. The distribution of the distance travelled for adult is right-skewed reflecting that most adult travel short distances. Furthermore, 50% of the journeys made cover up to 2.7km.
Elderly
The distribution for elderly data is very similar to the adult data. The average distance travelled for elderly is 4.5km. The right-skewed distribution shows that most elderly travel shorter distances and 50% of the trips made cover up to 2.8km.
Student
However, unlike the adult and elderly, the distribution for distance travelled for students is right-skewed and 50% of the trips made are less than 2.3km. On average, the distance travelled by students is 3.6km with a distance decay index of 3.6 after taking into account all the purpose of their journey.
Time Taken
| Adult | Elderly | Student | |
| Average Time Taken (mins) | 14.50 mins | 15.43 mins | 12.74 mins |
| Median Time Taken (mins) | 10.43 mins | 10.82 mins | 9.45 mins |
Adult
The distribution for travelling time is right skewed and is in line with the distribution for distance travelled where most adults travel for a shorter time period. The average travelling time for a commuter is 14.5 minutes and 50% of the journeys took at 10.433 minutes.
Elderly
Similar to the distribution of travelling time for adult, the distribution for elderly is also right skewed. The average time taken for travelling is 15.39 minutes and 50% of the journeys took 10.85 minutes. This distribution correlates with the distance travelled distribution where most elderly travel short distances.
Student
Likewise, for the students, the average travelling time for a commuter would be about 13 minutes. 50% of the trips made by students are less than 10 minutes. The histogram above shows a right skewed distribution reflecting that most people travel for a shorter period in time. This is in line with the findings of the distance travelled for students.
Peak Periods
| Adult | Elderly | Student | |
| Peak Periods | Morning: 7am to 9am Evening: 5pm to 7pm |
9am to 12pm | Morning: 630am to 730am Afternoon: Monday to Thursday 230pm to 330pm Friday 1230pm to 130pm |
Adult
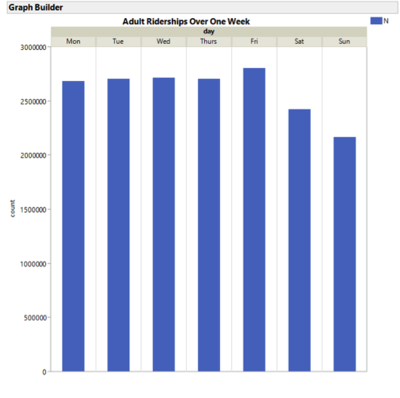
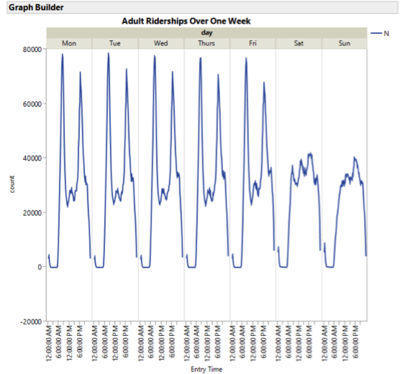
From the number of riderships over one week, it can be seen that there are more commuters who travel by bus on weekdays. Also, we have observed that there are two peaks on weekdays. They are the following: in the morning from 7am to 9am, and in the evening from 5 pm to 8 pm. This highlights that the adults may be mainly travelling to work during these morning peak hours, and back from work, during the evening peak hours.
Elderly
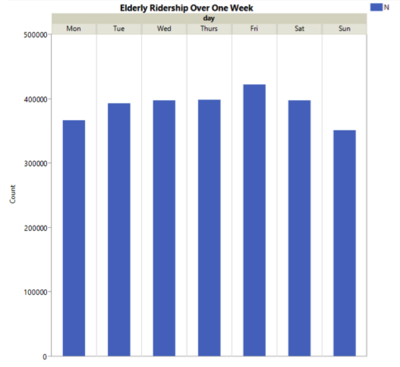
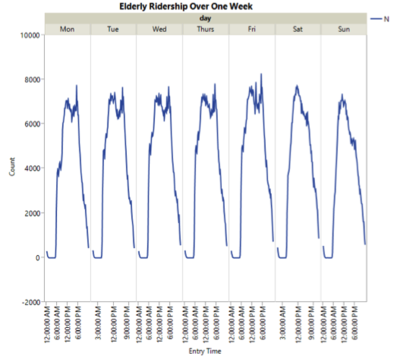
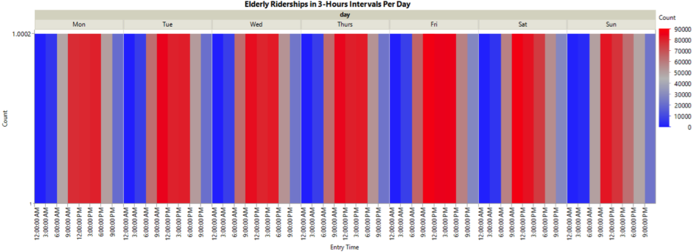
There are no differences in riderships between weekdays and weekends as all bars in the top left chart have similar heights. As such, there will not be any distinction of peak periods between weekdays and weekends. In addition, there are no distinct peaks in the line chart indicating the peak hours that elderly would commute most. Hence, a heatmap is done to visualise which are the hours that have higher number of riderships. 9am-12pm is selected as the peak period for elderly as this segment has the brightest red throughout the week.
Student
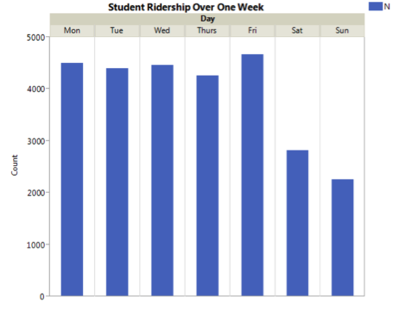
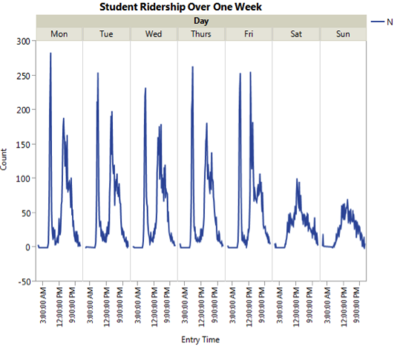
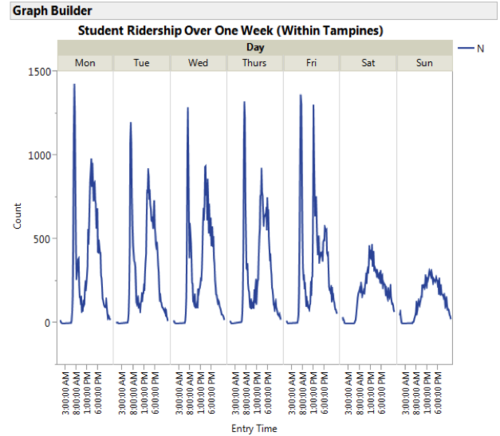
From the graph, higher student ridership is observed on weekdays as compared to weekends. Student ridership on weekdays is also relatively constant. Two peaks are observed on weekdays whereas an inverted U-shaped graph is observed on weekends. This indicates the presence of peak hours on weekdays whereas there tend to be more students in the afternoon on weekends. For Monday - Thursday, the peak is roughly at 6.30am-7.30am and 2.30pm-3.30pm. For Friday, the peak is at 6.30am-7.30am and 12.30pm-1.30pm. This highlights that students are mainly travelling to school during morning peak whereas for afternoon peak, students might be travelling home or to nearby commercial areas after school.
Popular Destinations
| Adult | Elderly | Student | |
| List of Popular Destinations (Planning Areas) |
|
|
|
Adult
From the number of riderships over one week, it can be seen that there are more commuters who travel by bus on weekdays. Also, we have observed that there are two peaks on weekdays. They are the following: in the morning from 7am to 9am, and in the evening from 5 pm to 8 pm. This highlights that the adults may be mainly travelling to work during these morning peak hours, and back from work, during the evening peak hours.
Elderly
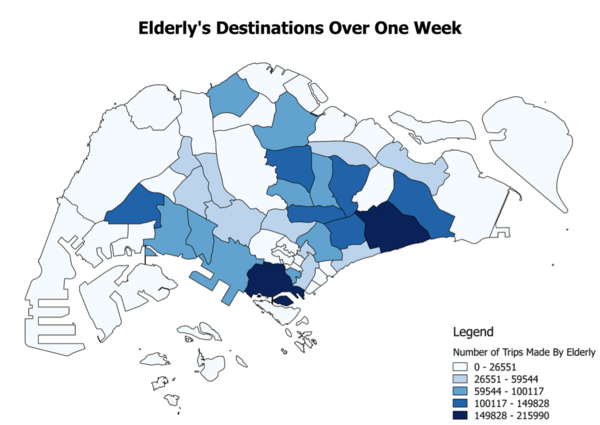
This choropleth map shows the number of destinations where commuters travel to. The darker coloured planning areas, such as Bukit Merah and Bedok, indicates that more trips are made by the elderly. The other planning areas where elderly would travel to next include Ang Mo Kio, Jurong East, Hougang, Toa Payoh, Geylang and Tampines. Unlike the adult, the elderly do not travel to the Central Business District areas.
Student
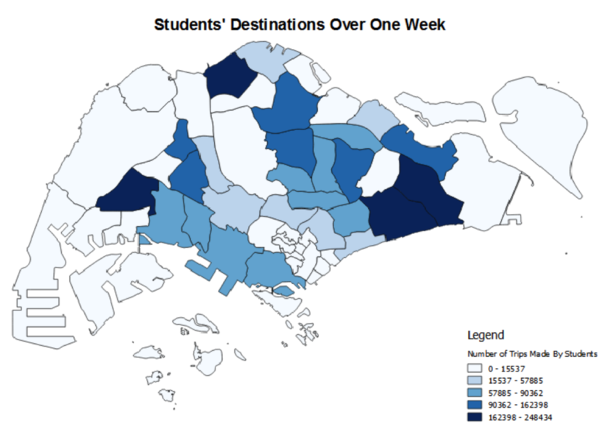
A choropleth map based on the number of trips made to the respective planning areas has been created using the natural breaks mode. Based on the map above, students travel most frequently to Jurong West, Woodlands,Tampines and Bedok.
Distribution of Travelling Patterns
| Adult | Elderly | Student | |
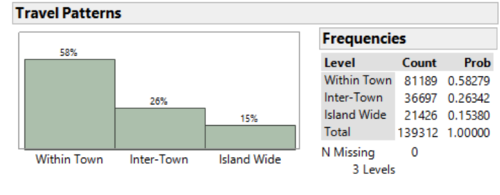
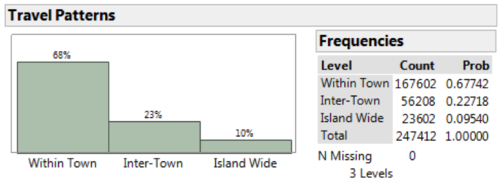
| Within Tampines | 64% | 59% | 68% |
| Inter-Town | 23% | 26% | 23% |
| Island Wide | 13% | 15% | 10% |
Adult
Elderly
Student
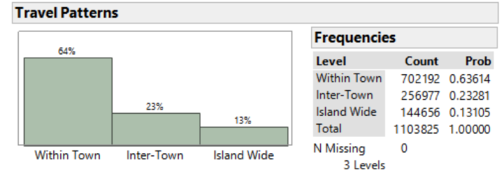
As shown in the distribution charts above for all demographic groups, majority of the trips made are within town, where trips start from and end within Tampines planning area. The next most trips made is inter-town where trips end at nearby towns such as Bedok, Changi, Paya Lebar and Pasir Ris, within the east region. Last but not least, the regions outside the East Region are the least frequented to, from Tampines itself.
Distribution within Tampines Planning Area
Distance Travelled
| Adult | Elderly | Student | |
| Average Distance (km) | 1.90 km | 1.83 km | 2.02 km |
| Median Distance (km) | 1.70 km | 1.80 km | 1.80 km |
| Distance Decay Index | 1.90 | 1.83 | 2.02 |
Adult
The distribution for distance travelled for the adult data is right-skewed. This is because most of the trips that were made were of or less than 1.7km. On average, the distance travelled by adults is 1.9km.
Elderly
Similar to the distribution done for the adult data, the distribution of distance travelled for elderly is right-skewed. The low distance decay index shows that the elderly are more susceptible to travel short distances with an average of 1.82km while 50% of the trips made cover 1.6km.
Student
Likewise for students, the distribution for distance travelled is also right-skewed. 50% of the trips made are less than 1.8km; on average, the distance travelled by students is 2 km with a distance decay index of 2 after taking into account all the purpose of their journey within Tampines.
Time Taken
| Adult | Elderly | Student | |
| Average Time Taken (mins) | 8.54 mins | 8.13 mins | 9.12 mins |
| Median Time Taken (mins) | 7.85 mins | 10.43 mins | 8.23 mins |
Adult
The average travelling time is about 8.5 minutes, and about 50% of commuters take 7.85 minutes to travel. Most people travel for a shorter period in time as the histogram is right-skewed.
Elderly
Just like the adult data, the average time spent for trips made by elderly is 8.13min and 50% of the elderly travelling within Tampines take about 7.25min for each trips.
Student
Likewise, the average travelling time for a commuter would be about 9 minutes. 50% of the trips made by students are less than 10 minutes.
Peak Periods
| Adult | Elderly | Student | |
| Peak Periods | Morning: 7am to 9am Evening: 5pm to 7pm |
9am to 12pm | Morning: 630am to 730am Afternoon: Monday to Thursday 230pm to 330pm Friday 1230pm to 130pm |
Adult
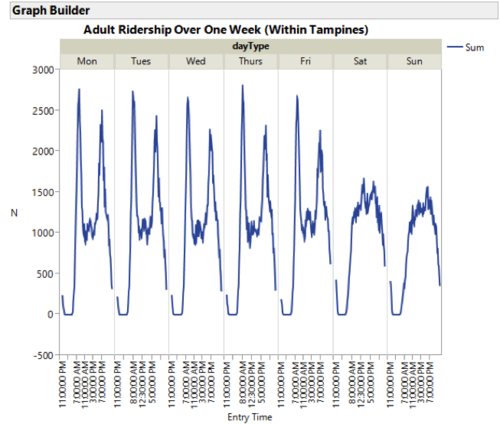
Two peaks are observed during weekdays, whereas a general inverted U-shape is observed for weekends. The peak periods are separated into two periods, 7-9am for the morning peak period, and 5-8pm for the evening peak period.
Elderly
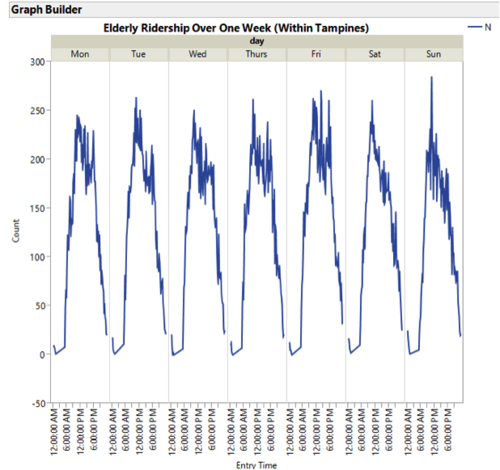
There is no significant difference between the activities during weekdays and weekends where elderly travel within Tampines compared to trips made islandwide. However, there is a peak in a period of time between 9am and 12pm which remains the same for the overall elderly commuting patterns islandwide.
Student
There are two peaks observed on weekdays whereas a shorter inverted U-shaped graph is observed on weekends. This indicates the presence of peak hours on weekdays whereas there tend to be more students in the afternoon on weekends. For Monday - Thursday, the peak is roughly at 6.30am-7.30am and 2.30pm-3.30pm. For Friday, the peak is at 6.30am-7.30am and 12.30pm-1.30pm.
Popular Destinations
| Adult | Elderly | Student | |
| List of Popular Destinations |
|
|
|
insert diagrams
Distribution for Commuters Who Make At Least 4 Trips During Peak Hours in a Week
Distance Travelled
| Adult | Elderly | Student | |
| Average Distance (km) | 1.93 km | 1.68 km | 1.79 km |
| Median Distance (km) | 1.80 km | 1.60 km | 1.79 km |
| Distance Decay Index | 1.93 | 1.68 | 1.79 |
Adult
The distance travelled is right-skewed and 50% of the trips are less than 1.8km. On average, the distance travelled by adults is 1.93km, with a distance decay index of 1.93. This is slightly greater than the distance decay index of all the trips made from Tampines itself.
Elderly
The distribution of the distance is right-skewed where the average distance travelled is 1.68km and 50% of trips made covers 1.6km. The short distances travelled reflects on the low distance decay function of 1.68.
Student
From the dataset, the distribution for distance travelled is right-skewed and 50% of the trips made are less than 1.6km. The average distance travelled by students to school is 1.8 km with a distance decay index of 1.8.
Time Taken
| Adult | Elderly | Student | |
| Average Time Taken (mins) | 9.49 mins | 7.06 mins | 9.05 mins |
| Median Time Taken (mins) | 8.93 mins | 6.50 mins | 8.07 mins |
Adult
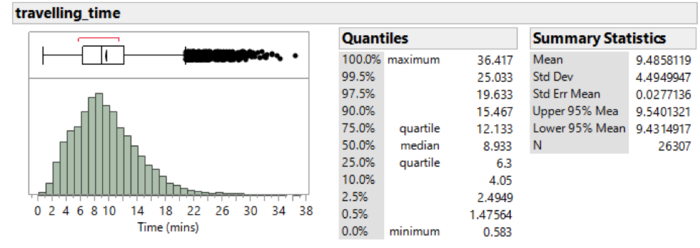
The average travelling time for a commuter would be around 9.5 minutes. 50% of the trips made by adults are less than 8.933 minutes. From this distribution, we can see that most people travel shorter distances.
Elderly
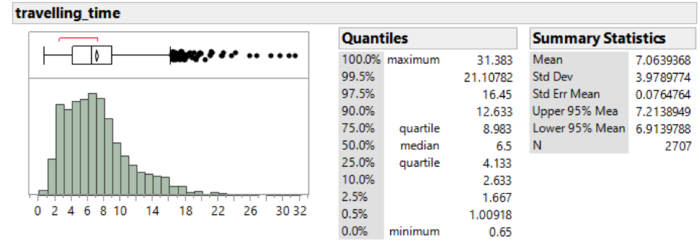
Unlike the distribution of travelling time by the adults, elderly tend to travel shorter time of 7.06min compared to the adults. Nevertheless, 50% of the trips made have similar travelling time, of 6.5min, corresponding to the adults.
Student
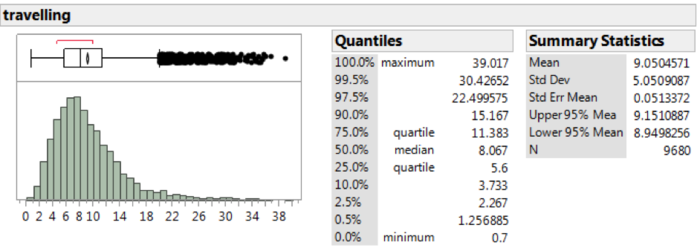
Likewise, the average travelling time for a commuter would be about 9 minutes. 50% of the trips made by students are less than 10 minutes. From the distribution, we can also see that most people travel for a shorter period in time, as the histogram is right-skewed. This is in line with the findings of the distance travelled for commuters.
Popular Destinations
| Adult | Elderly | Student | |
| List of Popular Destinations |
|
|
|
insert diagrams


