Difference between revisions of "Griffins Project Management"
Jump to navigation
Jump to search
| Line 99: | Line 99: | ||
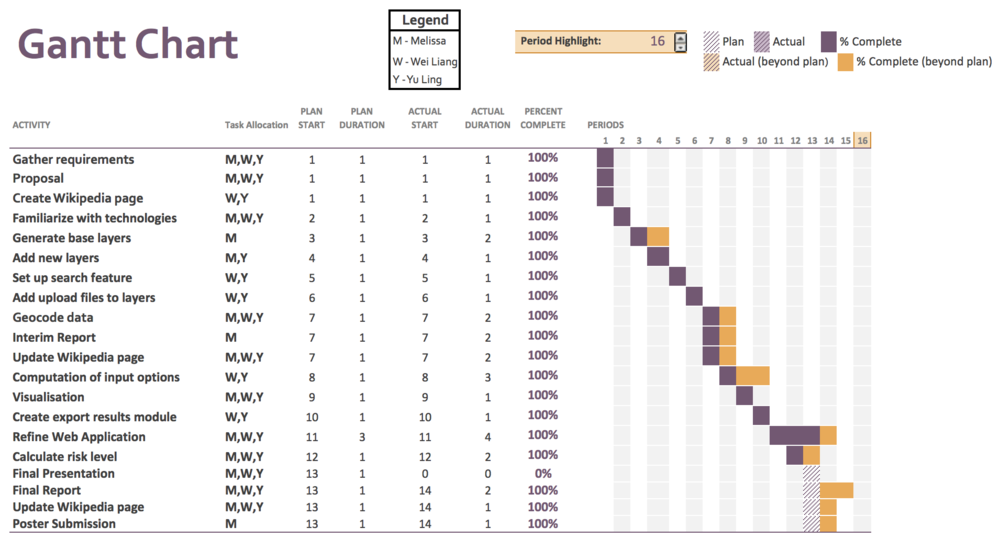
<div style="background: #0081a1; padding: 5px; font-weight: bold; line-height: 1em; text-indent: 15px; border-left: #FF8819 solid 32px; font-size: 16px"><font color="#fff">Gantt Chart</font></div> | <div style="background: #0081a1; padding: 5px; font-weight: bold; line-height: 1em; text-indent: 15px; border-left: #FF8819 solid 32px; font-size: 16px"><font color="#fff">Gantt Chart</font></div> | ||
| − | [[Image: | + | [[Image:Gantt-chart.png|1000px|link=]] |
Latest revision as of 14:13, 16 April 2016
| Home | Project Report | Project Management | Deliverables |
|---|
Schedule
| Week No./Date | Tasks | Milestones | Minutes |
|---|---|---|---|
| Week 1 4/1/2016 |
Finalise our project sponsor Gather requirements |
10 Jan 2359 Proposal & Wiki page |
Minutes 1 |
| Week 2 11/1/2016 |
Obtain data Familiarize with technologies Generate base layers for the web application |
||
| Week 3 18/1/2016 |
Generate base layers for the web application | Minutes 2 | |
| Week 4 25/1/2016 |
Add new layers into web application | Minutes 3 | |
| Week 5 1/2/2016 |
Set up search feature | Minutes 4 | |
| Week 6 8/2/2016 |
Add upload files to layer feature | Client Review Session | |
| Week 7 15/2/2016 |
Geocode data | Interim Report Update Wiki page |
Minutes 6 |
| Week 8 22/2/2016 |
Computation of input options | ||
| Week 9 29/2/2016 |
Visualisation | ||
| Week 10 7/3/2016 |
Create export results module | Minutes 7 | |
| Week 11 14/3/2016 |
Computation of KPI | Conference Paper Abstract Submission | |
| Week 12 21/3/2016 |
Computation of KPI | Client Review Session Conference Paper Draft Submission |
Minutes 8 |
| Week 13 28/3/2016 |
Visualise risk levels of HDB blocks | Minutes 9 | |
| Week 14 4/4/2016 |
Visualise risk levels of HDB blocks Simplify data update process |
||
| Week 15 11/4/2016 |
Simplify data update process Refine web application |
Final Conference Paper Submission Update Wiki page Poster submission |
|
| Week 16 18/4/2016 |
Refine web application | Data Analytics Conference and Presentation |
Gantt Chart