Difference between revisions of "Car Park Overspill Study PROJECT DOCUMENTATION"
| Line 63: | Line 63: | ||
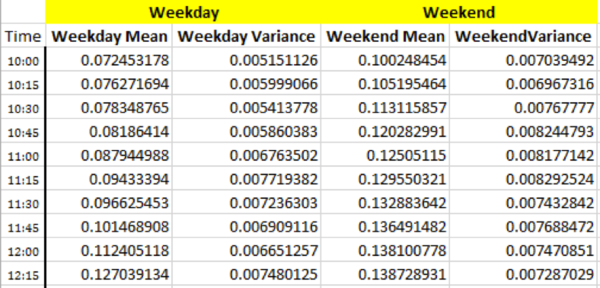
After normalising each dataset (pertaining to a development site), we found the mean and variance of all datasets within one category at each given time interval. This is to generalise the data across the entire category. For example, the following screenshot shows the mean and its corresponding variance for normalised data points across entire shopping mall datasets:<br /> | After normalising each dataset (pertaining to a development site), we found the mean and variance of all datasets within one category at each given time interval. This is to generalise the data across the entire category. For example, the following screenshot shows the mean and its corresponding variance for normalised data points across entire shopping mall datasets:<br /> | ||
| − | [[File:ZW Picture2.png| | + | [[File:ZW Picture2.png|600px|center]] |
=== Data Distribution === | === Data Distribution === | ||
Revision as of 18:25, 28 February 2016
Contents
Preliminary Phase
Scope
Our sponsor requires us to finish 5 final reports of different development sites during the preliminary phase of our project. The necessary data and infographics are prepared by the sponsor and his tea, our job scope is to compile the report using the sample template and interpret the data to generate some insights which can be helpful for LTA future planning. A typical final report contains the following components:
- Executive Summary
- Site Background
- Site Characteristics
- Site Assessment
- Survey Findings
- Conclusion
“Executive Summary” gives a brief overview of the report and its conclusion. “Site Background”, “Site Characteristics” and “Site Assessment” provides the basic information of the site, such as the nature, the size, the transportation availability of the site and etc. Our focus is on “Survey Findings” which uses the data collected on both weekday and weekend at the site to generate some insights. The generated insights elaborate on the vehicles traffic pattern, the human traffic during different period of the day and most importantly whether there is overspill, this helps LTA understands the utilization rate of the car park and make certain adjustments in the future.
Actual Deliverables
By the end of the preliminary phase, our group has finished 5 final reports as planned at the beginning of the project. These 5 final reports are:
- Final Report - Greenwood Ave & Hillcrest Rd
- Final Report - Vivocity
- Final Report - Frankel Ave
- Final Report - Jalan Mata Ayer
- Final Report - Yuhua Market & Hawker Centre
Preprocessing Data
Data Exploration
There are 55 sites in total, each site has a dataset containing development human headcount data and the development car park (if any) vehicle count data during survey period. A typical car park dataset contains the following information: No. of cars parked in season lots, No. of cars in the car park, No. of Overspills. Survey time spans from 7am to 10am. Data is collected in 15 minutes interval during the survey time. Same data collecting frequency applied to human count, human count dataset rather contains the following information: human count in and human count out within each time interval. We had following findings:
- Difficulty in counting the real headcount in surveyed development
A primary problem of the collected data is that we cannot assure the real headcount in the development, as in most cases, there is no record of current human count in the development. Therefore, human count in and out data record just provide us the human traffic information. Besides, we found in many datasets, there is one or more record gap(s) between two time intervals with the human traffic recorded. This further increases the difficulty of finding real headcount in a development building.
- Insufficiency of collected raw data
We also realised that for each surveyed site, there are only two days of records.one set is for weekday and the other is for weekend. Having insufficient data would lower the confidence of collected data in representing the ordinary situation happens in the surveyed site everyday.
Data Preparation
In order to uncover the common characteristics of sites within a same category and expose the differences of sites from different categories, we firstly grouped each dataset by its category (hawker centre, community centre, shopping mall or F&B cluster).
We understood that the size of the surveyed development may affect the carpark traffic. In order to remove the development size factor, we decided to normalise each site’s data by applying the following formula for weekday and weekend separately:
No. of vehicles / maximum cumulative human headcount within the day
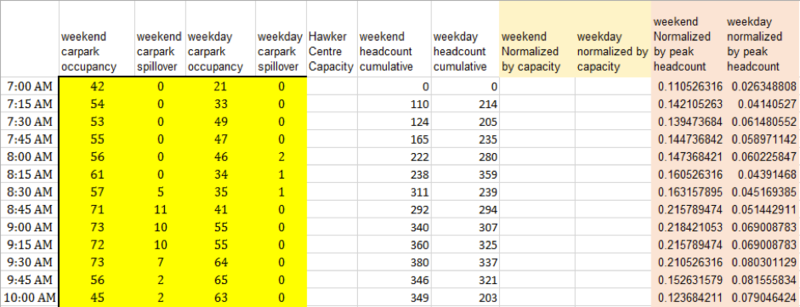
Below shows the screenshot of a sample normalised data:
After normalising each dataset (pertaining to a development site), we found the mean and variance of all datasets within one category at each given time interval. This is to generalise the data across the entire category. For example, the following screenshot shows the mean and its corresponding variance for normalised data points across entire shopping mall datasets:
Data Distribution
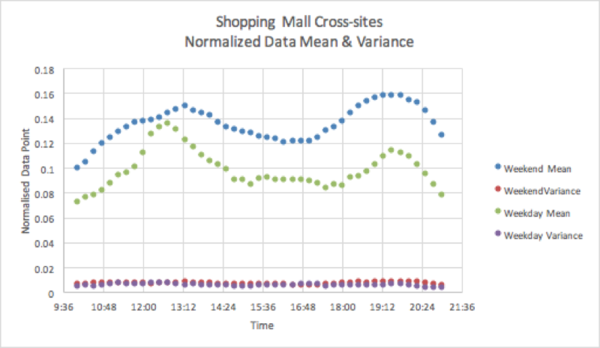
We did a cross-sites data distribution analysis for each category. The following charts show the mean and its associated variance during each time interval. By plotting the distribution of cross-sites data, we can better understand the data characteristics of different development site categories.
Shopping Mall Cross-site chart shown reveals the following characteristics of Shopping mall datasets:
- All the data is collected from 10am to 9pm
- The distribution of normalised data points for each site is very close to the cross-sites data mean at all time period, as the variance are always less than 0.02. We can conclude that the mean values can well represent the data points of every site.
- At any given time interval, weekend mean is higher than weekday mean. This indicates that the vehicle per headcount ratio tends to be higher at weekend than weekday at shopping mall in general.
- The vehicle per headcount ratio peaks at around 12am and 7pm
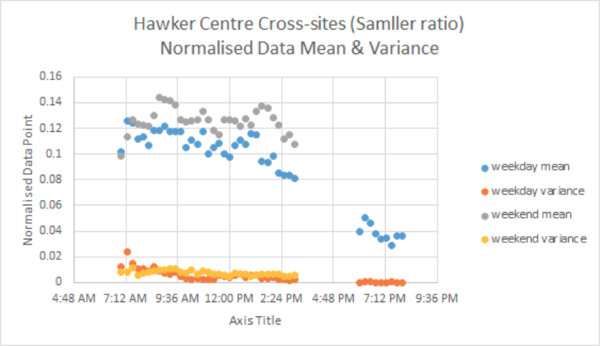
We further divided Hawker Centre datasets into two groups as we have realised that the vehicle per headcount ratios deviate between the two groups, as we can see in below charts:
Those Hawker Centres with smaller vehicle per headcount ratio are at surveyed sites like Yuhua, Holland Drive, Marine Parade, Marsiling. By viewing the distribution, we can conclude:
- Weekend data is collected from 7am to 3pm, while weekday data covers not only the period from 7am to 3pm, but also with extra period from 6pm to 8pm
- On both weekday and weekend, the vehicle per headcount ratio tends to reach peak during period around 9am and lunch hours (12pm to 1pm)
- Weekend mean values are generally higher than weekday mean values at a given time period
- We can say the mean values can be considered as a good representative of cross-sites data, as the most of the variance values dropped within the range below 0.02
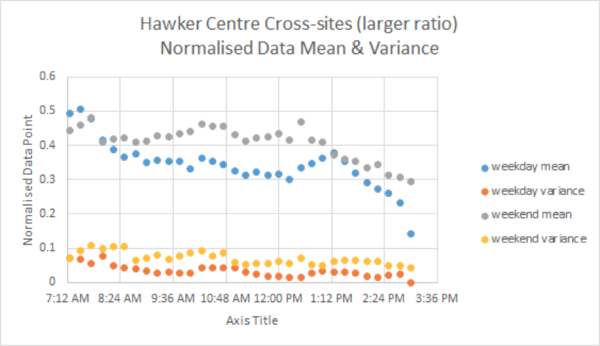
Those Hawker Centres with larger vehicle per headcount ratio are surveyed sites like Boon Keng, New Upper Changi Rd Blk 208, new Upper Changi Rd Blk 58, Hougang, Serangoon. We can conclude the followings:
- The data was collected from 7am to 3pm on both weekday and weekend
- The majority of data points fall within the range between 0.3 and 0.5
- Weekday data shows that the mean value peaks around 7am and 1:30pm on the survey day, while weekend data shows that the mean value peaks around 7:45am and 12:30pm on the survey day
- The variance values generally are less than 0.1 which indicates there are some deviations in cross-site data.
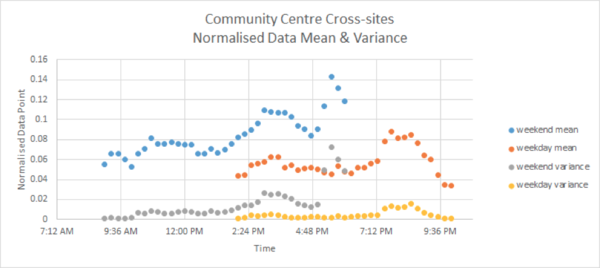
The Community Centre data was collected from 2pm to 10pm on weekday while from 9am to 6pm on weekend. Based on the data, we can say that the vehicle per headcount ratio reaches its peak at around 8pm on weekday and 5:30pm on the weekend. The majority of variance values fall within the range below 0.02. The variance values tend to increase slightly during the peak hours. These indicate that the vehicle per headcount ratios across sites do not deviate from the mean much at non-peak hours, while start to deviate during peak hours on both days.
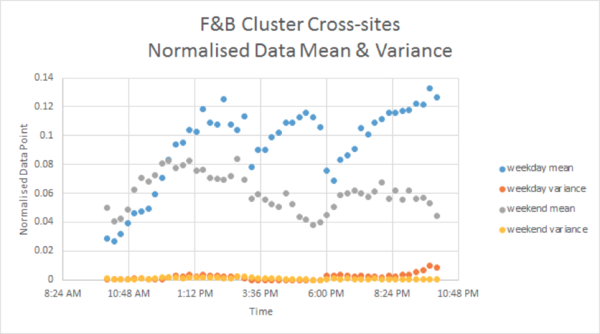
After removing outliers, F&B Cluster cross-sites data distribution has the following characteristics:
- The data was collected from 10am to 10pm on both weekday and weekend.
- The vehicle per headcount ratio tends to peak around 2pm, 5pm and 10pm on weekday, while around 1pm, 8pm on weekend.
- The variances are small on both days.
