Difference between revisions of "ANLY482 AY2017-18T2 Group32 : Project Findings"
| (3 intermediate revisions by the same user not shown) | |||
| Line 25: | Line 25: | ||
{| width="100%" cellspacing="0" cellpadding="0" valign="top" | | {| width="100%" cellspacing="0" cellpadding="0" valign="top" | | ||
| − | | style="padding: 0.25em; font-size: 90%; border-top: 1px solid #cccccc; border-left: 1px solid #cccccc; border-bottom: 1px solid #cccccc; text-align:center; background-color: #404040; width:50%" | [[ANLY482 AY2017-18T2 Group32 : Project Findings | <font color="#ffffff ">Interim</font>]] | + | | style="padding: 0.25em; font-size: 90%; border-top: 1px solid #cccccc; border-left: 1px solid #cccccc; border-bottom: 1px solid #cccccc; text-align:center; background-color: #404040; width:50%" | [[ANLY482 AY2017-18T2 Group32 : Project Findings | <font color="#ffffff">Interim</font>]] |
| − | | style="padding: 0.25em; font-size: 90%; border-top: 1px solid #cccccc; border-left: 1px solid #cccccc; border-right: 1px solid #cccccc; border-bottom: 1px solid #cccccc; text-align:center; background-color: none; width:50%" | [[ANLY482 AY2017-18T2 Group32 : Project Findings / Final | <font color="#FCB706">Final</font>]] | + | | style="padding: 0.25em; font-size: 90%; border-top: 1px solid #cccccc; border-left: 1px solid #cccccc; border-right: 1px solid #cccccc; border-bottom: 1px solid #cccccc; text-align:center; background-color: none; width:50%" | [[ANLY482 AY2017-18T2 Group32 : Project Findings / Final | <font color="#FCB706">Final</font><small><sup><font color="#ff0000">'''new!'''</font></sup></small>]] |
|} | |} | ||
| Line 59: | Line 59: | ||
==<div style="background: #404040; padding: 15px; font-weight: bold; line-height: 0.3em; text-indent: 15px; font-size: 16px"><font color=#ffffff >2.0 Initial Visualization Dashboard </font></div>== | ==<div style="background: #404040; padding: 15px; font-weight: bold; line-height: 0.3em; text-indent: 15px; font-size: 16px"><font color=#ffffff >2.0 Initial Visualization Dashboard </font></div>== | ||
| + | <b><font color="#f6a228">Renewal Rate</font></b> | ||
We have completed our analysis for the first KPI. The following calculation was used to obtain the renewal rate for TCE products: | We have completed our analysis for the first KPI. The following calculation was used to obtain the renewal rate for TCE products: | ||
[[File:Insights_1.png | 600px | center]] | [[File:Insights_1.png | 600px | center]] | ||
| − | Based on our calculations, current renewal rate for Pharma G is at 47%, which is quite far away from their target of 95%. | + | Based on our calculations, current renewal rate for Pharma G is at 47%, which is quite far away from their target of 95%. |
| + | <b><font color="#f6a228">Distribution of Sales by Product</font></b> | ||
| + | We have also used a Pareto chart to understand the distribution of sales from products. | ||
| + | [[File:ProductPareto.png | 600px | center]] | ||
==<div style="background: #404040; padding: 15px; font-weight: bold; line-height: 0.3em; text-indent: 15px; font-size: 16px"><font color=#ffffff >3.0 Future Deliverables </font></div>== | ==<div style="background: #404040; padding: 15px; font-weight: bold; line-height: 0.3em; text-indent: 15px; font-size: 16px"><font color=#ffffff >3.0 Future Deliverables </font></div>== | ||
| + | |||
| + | <b>Create dashboards for all 3 KPIS</b><br> | ||
| + | In order to build a dashboard that can effectively capture the product sales performance, we have adopted the following steps: <br> | ||
| + | |||
| + | <u>1. Brainstorm suitable Dashboard elements</u><br> | ||
| + | Using the current dashboard that our sponsor is using as a reference, we will be looking at literature review to understand more about dashboard design. | ||
| + | |||
| + | <u>2. Initial review of dashboard</u><br> | ||
| + | |||
| + | <u>3. Finalize dashboard and ensure the quality of data presented</u><br> | ||
Latest revision as of 15:57, 17 April 2018
| Interim | Finalnew! |
1.0 Initial Exploratory Data Analysis
We conducted an initial data observation to seek some initial insights between sales and healthcare organizations as well as to understand what products Pharma G's account representatives are pushing to healthcare practitioners.
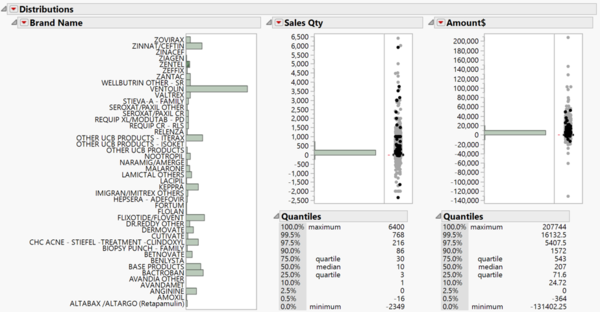
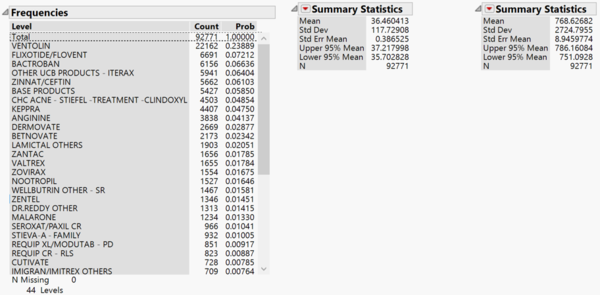
For Invoice Data, after filtering for the TCE brands here are the distribution of all TCE brands and its sales performance.
Sales across various Channels
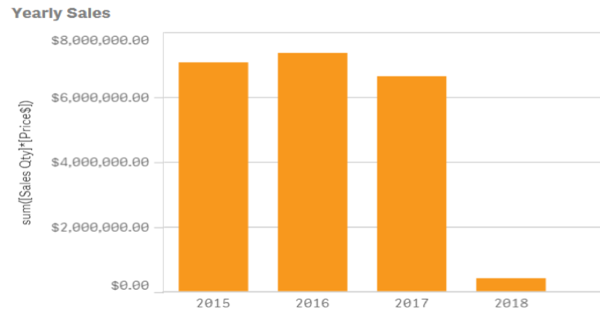
Pharma G appears to have a strong performance in 2016 but sales amount decreased by 9% to a 3-year low in 2017. This signals a need to for Pharma G to keep their sales team in check using Key Performance Indicators as mentioned above.
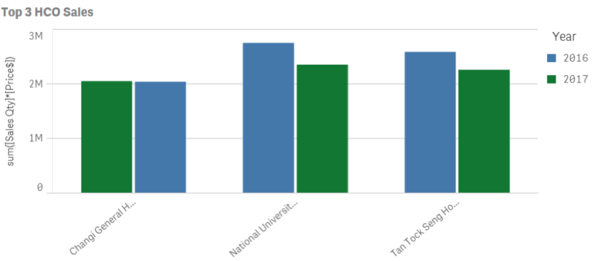
This could be attributed to the drop in sales from the general hospitals which generate 42% of yearly revenue. Pharma G saw a decrease in sales revenue from its top 3 buyers from 2016.
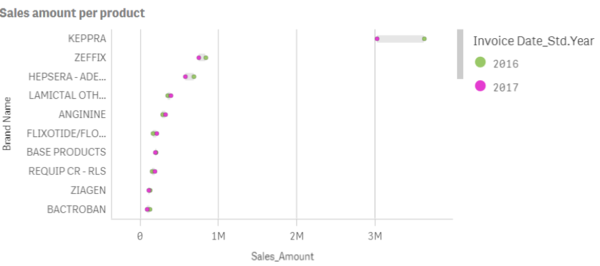
Lastly, the top three products brought in lesser revenue last year as compared to 2016. Most notably, their best selling drug saw a sharp decrease in sales last year, falling by 8.8%.
Telesales by Account Representative
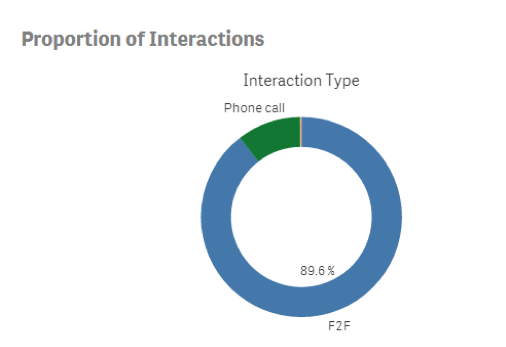
89.6% of all interactions are face to face, which explains why interaction duration can go as high as >300 minutes as Sales Representatives may need more time to build rapport. In addition, there seems to be a correlation between the number of products pushed to the practitioner and the interaction duration. For a huge client like hospital, the representative may need to push for several product lines whereas a small clinic will only need a fraction of it.
However, as the TCE brands are at their end-of-life cycle, the accounts for these TCE brands are handled from the Sales Representatives to the Account Representatives (AR). The AR only need to call the doctors and nurses in each organization and try to sell a new product or convince them to buy another batch of an existing drug in their inventory. Hence, we are only focusing on the AR from the calls observation, to have a better understanding of their performance.
2.0 Initial Visualization Dashboard
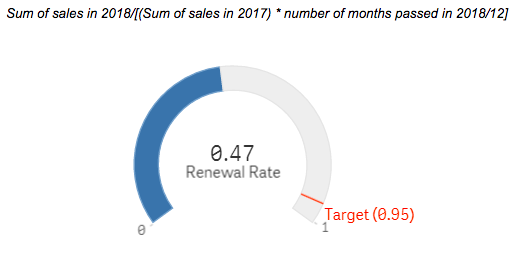
Renewal Rate We have completed our analysis for the first KPI. The following calculation was used to obtain the renewal rate for TCE products:
Based on our calculations, current renewal rate for Pharma G is at 47%, which is quite far away from their target of 95%.
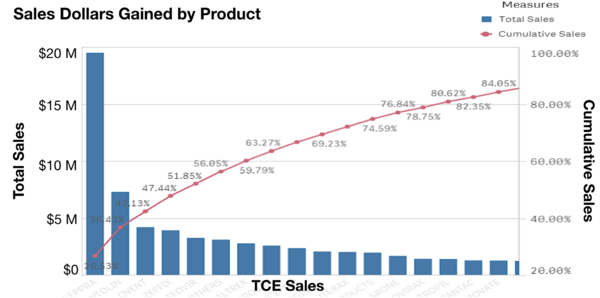
Distribution of Sales by Product We have also used a Pareto chart to understand the distribution of sales from products.
3.0 Future Deliverables
Create dashboards for all 3 KPIS
In order to build a dashboard that can effectively capture the product sales performance, we have adopted the following steps:
1. Brainstorm suitable Dashboard elements
Using the current dashboard that our sponsor is using as a reference, we will be looking at literature review to understand more about dashboard design.
2. Initial review of dashboard
3. Finalize dashboard and ensure the quality of data presented

