Difference between revisions of "REO Project Findings EDA"
Gtong.2014 (talk | contribs) |
Gtong.2014 (talk | contribs) |
||
| (5 intermediate revisions by the same user not shown) | |||
| Line 38: | Line 38: | ||
| style="padding: 0.25em; font-size: 90%; border-top: 1px solid #cccccc; border-left: 1px solid #cccccc; border-right: 1px solid #cccccc; border-bottom: 1px solid #cccccc; text-align:center; background-color: #404040; width:30%" | [[REO_Project_Findings_EDA | <font color="#ffffff">Exploratory Data Analysis</font>]] | | style="padding: 0.25em; font-size: 90%; border-top: 1px solid #cccccc; border-left: 1px solid #cccccc; border-right: 1px solid #cccccc; border-bottom: 1px solid #cccccc; text-align:center; background-color: #404040; width:30%" | [[REO_Project_Findings_EDA | <font color="#ffffff">Exploratory Data Analysis</font>]] | ||
| − | | style="padding: 0.25em; font-size: 90%; border-top: 1px solid #cccccc; border-left: 1px solid #cccccc; border-right: 1px solid #cccccc; border-bottom: 1px solid #cccccc; text-align:center; background-color: none; width:30%" | [[REO_Project_Findings_Cluster | <font color="#053B6B"> | + | | style="padding: 0.25em; font-size: 90%; border-top: 1px solid #cccccc; border-left: 1px solid #cccccc; border-right: 1px solid #cccccc; border-bottom: 1px solid #cccccc; text-align:center; background-color: none; width:30%" | [[REO_Project_Findings_Cluster | <font color="#053B6B">Clustering Analysis</font>]] |
|} | |} | ||
| + | ==Distribution== | ||
| + | <b>Users</b><br> | ||
| + | [[File:REO_fig31.png|300px]] <br> | ||
| + | Looking at the distribution of the Member_Days (Figure 31), the median value is 100 days higher than the mean value. This is a left-tail distribution with a bunch of 3 – 4 years members (850 to 1100 Member_Days). These could be the members who have been extensively recruited during their first year of launch in 2014. | ||
| − | + | <br><b>Subscription</b><br> | |
| − | [[File: | + | [[File:REO_fig32.png|300px]] <br> |
| − | + | Among the 20762 total users, there are 15323 (73.8%) free subscription plans users while there are 5439 (26.2%) paid subscription plans users. (Figure 32) | |
| − | |||
| − | + | <br><b>Sessions</b><br> | |
| − | [[File: | + | [[File:REO_fig33.png|300px]] <br> |
| + | By tabulating the data in the “user_id” view, the distribution can be generated for the number of sessions by each user. 118 outliers are excluded. | ||
| + | The distribution is highly skewed to the right with the mean almost four times of the median. The N tabulated here is only about 62% of the total users as seen from the Users files. (Figure 33) | ||
| − | + | The nature of a property agent work is not necessary regular and may not follow the usual office hours (9 am to 5 pm), hence the system log could be view from the hourly level to identify any trends from the users’ usage log. Sessions were tabulated by users_id with hours as columns before stacking the columns to conduct analysis on hours. 1423 outliers were excluded in the analysis.<br> | |
| + | [[File:REO_fig34.png|600px]] <br> | ||
| + | The distribution for each hour are found to be highly skewed to the right with the mean to be about twice the median. Using the Kruskai-Wallis Tests (Figure 34), which returns p-value <0.0001*, shows that the sessions count by the users for at least one hour period in the day is significantly different from another one hour period. <br> | ||
| + | [[File:REO_fig35.png|600px]] <br> | ||
| + | Steel-Dwass method is used instead of Wilcoxon Each Pair to control for overall alpha level [12]. Using the Nonparametric Comparisons for all Pairs using Steel-Dwass Method (Figure 35), which returns p-value for each pair of sessions count by users between any two hours. Most of the hours pairs were found to be significantly different with p-value <0.01. | ||
| + | As the data spans over 6 months, there could be seasonal effect or trends that could affect the usage of the agents, hence the system log could be view in a monthly view to capture any trends or observations. Sessions were tabulated by users_id with months as columns before stacking the columns to conduct analysis on months. 712 outliers were excluded in the analysis. <br> | ||
| + | [[File:REO_fig36.png|600px]] <br> | ||
| + | The distribution for each month are found to be highly skewed to the right with the mean to be more than 4 times the median. Using the Kruskai-Wallis Tests (Figure 36), which returns p-value <0.0001*, shows that the sessions count by the users for at least one month is significantly different from another month. <br> | ||
| + | [[File:REO_fig37.png|600px]] <br> | ||
| + | Using the Nonparametric Comparisons for all Pairs using Steel-Dwass Method, which returns p-value for each pair of sessions count by users between two months. With the exceptions of December and September pair, and December and October pair, all the remaining pairs are found to be significantly different. | ||
| − | + | As a property agent work may not follow the usual 5-days work week, hence the system log could be view from the different day of the week to identify any trends from the users’ usage log. Sessions were tabulated by users_id with day_of_week as columns before stacking the columns to conduct analysis on day_of_week. 661 outliers were excluded in the analysis.<br> | |
| − | [[File: | + | [[File:REO_fig38.png|600px]] <br> |
| − | <br> The | + | The distribution for each day of week are found to be highly skewed to the right with the mean to be more than 3 times the median. Using the Kruskai-Wallis Tests (Figure 38), which returns p-value <0.0001*, shows that the sessions count by the users for at least one day of week are significantly different from another day of the week. <br> |
| + | [[File:REO_fig39.png|600px]] <br> | ||
| + | Using the Nonparametric Comparisons for all Pairs using Steel-Dwass Method (Figure 39), which returns p-value for each pair of sessions count by users between any two days of the week. Most pairs were found to be significantly different with p-value <0.01 | ||
| − | + | <br><b>Listings</b> <br> | |
| − | [[File: | + | [[File:REO_fig40.png|300px]] <br> |
| − | <br> | + | By tabulating the data in the “user_id” view, the distribution can be generated for the number of listings by each user. 177 outliers are excluded. The distribution is skewed to the right with the mean greater than median. The N tabulated here is only about 83% of the users found in Sessions file. |
| − | |||
| − | + | As creating listings is one of the key activities an agent could do to gain more enquiries, this activity is similarly broken down by hours, months, and days of week just like what was done in Sessions. Listings were tabulated by users_id with hours as columns before stacking the columns to conduct analysis on hours. 660 outliers were excluded in the analysis. | |
| − | [[File: | + | <br>[[File:REO_fig41.png|600px]] <br> |
| − | <br> | + | The distribution for each hour are found to be rightly skewed with the mean greater than median. Other than hours 16 to 19, the median of the remaining hours are found to be 0 which implies the low count of listings during most hours. Using the Kruskai-Wallis Tests, which returns p-value <0.0001*, shows that the listings count by the users for at least one hour period is significantly different from another hour period. |
| − | + | <br>[[File:REO_fig42.png|600px]] <br> | |
| + | Using the Nonparametric Comparisons for all Pairs using Steel-Dwass Method, which returns p-value for each pair of listing count by users between any two hours. Most pairs were found to be significantly different with p-value <0.01. | ||
| + | Listings were tabulated by users_id with months as columns before stacking the columns to conduct analysis on months. 424 outliers were excluded in the analysis. | ||
| + | <br>[[File:REO_fig43.png|600px]] <br> | ||
| + | The distribution for each month are found to be rightly skewed with the mean greater than the median. Using the Kruskai-Wallis Tests, which returns p-value <0.0001*, shows that the listings count by the users for at least one month is significantly different from another month. | ||
| + | <br>[[File:REO_fig44.png|600px]] <br> | ||
| + | Using the Nonparametric Comparisons for all Pairs using Steel-Dwass Method (see below), which returns p-value for each pair of listing count by users between any two months. All of the pairs were found to be significantly different with p-value <0.01. | ||
| − | + | Listings were tabulated by users_id with day_of_week as columns before stacking the columns to conduct analysis on day_of_week. 684 outliers were excluded in the analysis. | |
| − | [[File: | + | <br>[[File:REO_fig45.png|600px]] <br> |
| − | <br>The | + | The distribution for each day of week are found to be rightly skewed with the mean greater than median. Using the Kruskai-Wallis Tests, which returns p-value <0.0001*, shows that the listings count by the users for at least one day of week is significantly different from another day of the week. |
| − | <br>[[File: | + | <br>[[File:REO_fig46.png|600px]] <br> |
| − | <br> | + | Using the Nonparametric Comparisons for all Pairs using Steel-Dwass Method (see below), which returns p-value for each pair of listing count by users between any two days of the week. Most pairs were found to be significantly different with p-value <0.01. |
| − | + | Listings have 2 source types as stated in the given data file. Agents can either post an organic listing which is original or a synced listing which is transported from an external portal. Listings were tabulated by users_id with source_type as columns before stacking the columns to conduct analysis on source types. 367 outliers were excluded in the analysis. | |
| − | [[File: | + | <br>[[File:REO_fig47.png|600px]] <br> |
| − | As | + | The distribution for each source_type is found to be highly skewed to the right with the mean to be greater than median. Using the Wilcoxon Tests, 2-Sample Test which returns p-value <0.0001*, shows that the listing count by the users for each source type are significantly different. Users have significantly more synced listings than organic listings. |
| + | |||
| + | <br><b>Cobroke</b> | ||
| + | <br>[[File:REO_fig48.png|300px]] <br> | ||
| + | By tabulating the data in the “user_id” view, the distribution can be generated for the number of cobroke requests sent by each user. 67 outliers are excluded. The distribution is skewed to the right with the mean greater than median. The N tabulated here is only about 16% of the users found in Sessions file. | ||
| + | |||
| + | As the user count for Cobroke is only a small percentage of the user count for Sessions, the breakdown of the data into other time series format would not be as meaningful. Furthermore, 99.co also feedback that their cobroke request is a function which has not always been properly utilised. Agents may spam that function as a mean to gain new networks rather than offering potential leads to the other agents. | ||
| + | |||
| + | <br><b>Enquiries</b> | ||
| + | <br>[[File:REO_fig49.png|300px]] <br> | ||
| + | By tabulating the data in the “user_id” view, the distribution can be generated for the number of enquiries received by each user. 101 outliers are excluded. The distribution is skewed to the right with the mean greater than median. The N tabulated here is only about 78% of the users found in Sessions file. | ||
| + | |||
| + | Enquiries received can be either from other agents or from consumers as stated in the given data file column “enquires_type”. Enquiries were tabulated by users_id with enquiries_type as columns before stacking the columns to conduct analysis on source types. 170 outliers were excluded in the analysis. | ||
| + | <br>[[File:REO_fig50.png|600px]] <br> | ||
| + | The distribution for each enquire type is found to be rightly skewed with the mean to be greater than median. Using the Wilcoxon Tests, 2-Sample Test which returns p-value <0.0001*, shows that the enquiries received by the users from agents or consumer are significantly different. Users have significantly more enquiries from consumers than agents. | ||
| + | |||
| + | ==Comparison by Subscription Plan== | ||
| + | Based on the subscription model of 99.co, there are 2 available subscription plans for all agents, either free or paid. For a free plan user, they are only entitled to a maximum of 5 listings. As for a paid plan user, they get 100 listings and have their listings featured on the portal. Due to the difference in both the payment and the benefits, it would be crucial to identify any differences in the data between paid and free users. | ||
| + | |||
| + | <br><b>Sessions by plan</b> | ||
| + | <br>[[File:REO_fig51.png|700px]] <br> | ||
| + | Using the Wilcoxon Tests, 2-Sample Test which returns p-value <0.0001*, shows that the sessions count by the subscription plan of the users are significantly different. It also showed that paid users have significantly more sessions recorded than free users. | ||
| + | |||
| + | <br><b>Listings types by plan</b> | ||
| + | <br>[[File:REO_fig52.png|700px]] <br> | ||
| + | Using the Wilcoxon Tests, 2-Sample Test which returns p-value <0.0001*, shows that the organic listings count by the subscription plan of the users are significantly different. It also showed that paid users have significantly more organic listings than free users | ||
| + | |||
| + | <br>[[File:REO_fig53.png|700px]] <br> | ||
| + | Using the Wilcoxon Tests, 2-Sample Test which returns p-value of 0.69, shows that the synced listings count by the subscription plan of the users are not significantly different. | ||
| + | |||
| + | <br><b>Cobroke by plan</b> | ||
| + | <br>[[File:REO_fig54.png|700px]] <br> | ||
| + | Using the Wilcoxon Tests, 2-Sample Test which returns p-value <0.0001*, shows that the cobroke request count by the subscription plan of the users are significantly different. It also showed that paid users send significantly more cobroke requests than free users | ||
| + | |||
| + | <br><b>Enquiries types by plan</b> | ||
| + | <br>[[File:REO_fig55.png|700px]] <br> | ||
| + | Using the Wilcoxon Tests, 2-Sample Test which returns p-value <0.0001*, shows that the enquiries from agent count by the subscription plan of the users are significantly different. It also showed that paid users received significantly more enquiries from agents than free users | ||
| + | <br>[[File:REO_fig56.png|700px]] <br> | ||
| + | Using the Wilcoxon Tests, 2-Sample Test which returns p-value <0.0001*, shows that the enquiries from consumers count by the subscription plan of the users are significantly different. It also showed that paid users received significantly more enquiries from consumers than free users | ||
| + | |||
| + | |||
| + | The few testes above have shown that paid users generally perform more activities and received more enquiries than the free users. Paid users had incurred a cost for the access of the platform, it is assumed and proven that they will be more committed in using the platform than the free users | ||
| + | |||
| + | ==Rencency Analysis (December)== | ||
| + | As the data spanned over 6 months, all the analysis was done using aggregated data. Through breaking the data down could give a deeper understanding on the usage rate per user per month. December’s data will be used, and it would also be most recent data collected. | ||
| + | Each data files were filter to month with label 12 and were tabulated before merging together. All the missing values indicate that the user did not perform that activity hence were replaced with ‘0’. Users with 0 sessions count on the month of December were filtered out, therefore the following distribution generated will be usage rate of the users who have at least 1 session count on December. After filtering the 0 count sessions as well as the outliers, there are a total of 9570 users. | ||
| + | <br>[[File:REO_fig57.png|900px]] <br> | ||
| + | The distributions of each activity are highly skewed and there are a huge percentage of users with 0 counts in other activities recorded. In fact, the median for all other activities are all less than 1. It also implies that among the users who log onto the platform on the month of Decembers, most of them do not perform other activities. This observation suggest that the team may face some difficult when conducting other further analysis – Clustering analysis. | ||
Latest revision as of 17:18, 16 April 2018
| Data Preparation | Exploratory Data Analysis | Clustering Analysis |
Distribution
Users
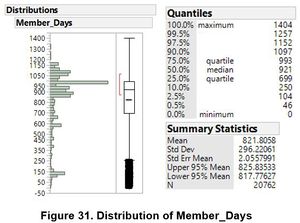
Looking at the distribution of the Member_Days (Figure 31), the median value is 100 days higher than the mean value. This is a left-tail distribution with a bunch of 3 – 4 years members (850 to 1100 Member_Days). These could be the members who have been extensively recruited during their first year of launch in 2014.
Subscription
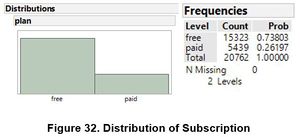
Among the 20762 total users, there are 15323 (73.8%) free subscription plans users while there are 5439 (26.2%) paid subscription plans users. (Figure 32)
Sessions
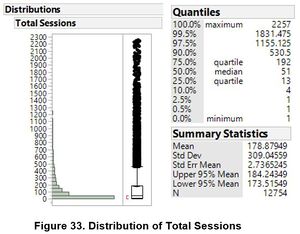
By tabulating the data in the “user_id” view, the distribution can be generated for the number of sessions by each user. 118 outliers are excluded.
The distribution is highly skewed to the right with the mean almost four times of the median. The N tabulated here is only about 62% of the total users as seen from the Users files. (Figure 33)
The nature of a property agent work is not necessary regular and may not follow the usual office hours (9 am to 5 pm), hence the system log could be view from the hourly level to identify any trends from the users’ usage log. Sessions were tabulated by users_id with hours as columns before stacking the columns to conduct analysis on hours. 1423 outliers were excluded in the analysis.
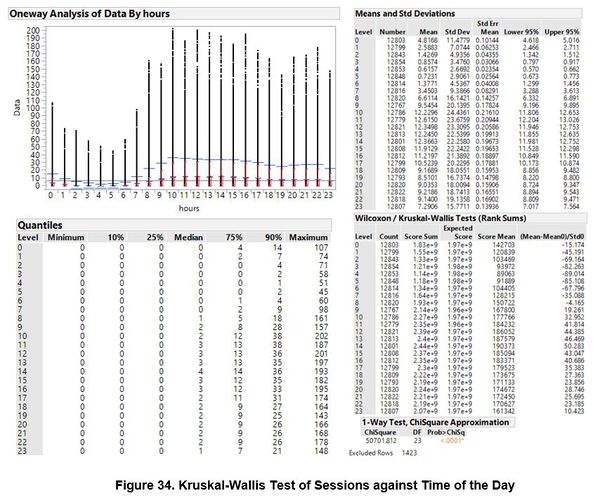
The distribution for each hour are found to be highly skewed to the right with the mean to be about twice the median. Using the Kruskai-Wallis Tests (Figure 34), which returns p-value <0.0001*, shows that the sessions count by the users for at least one hour period in the day is significantly different from another one hour period.
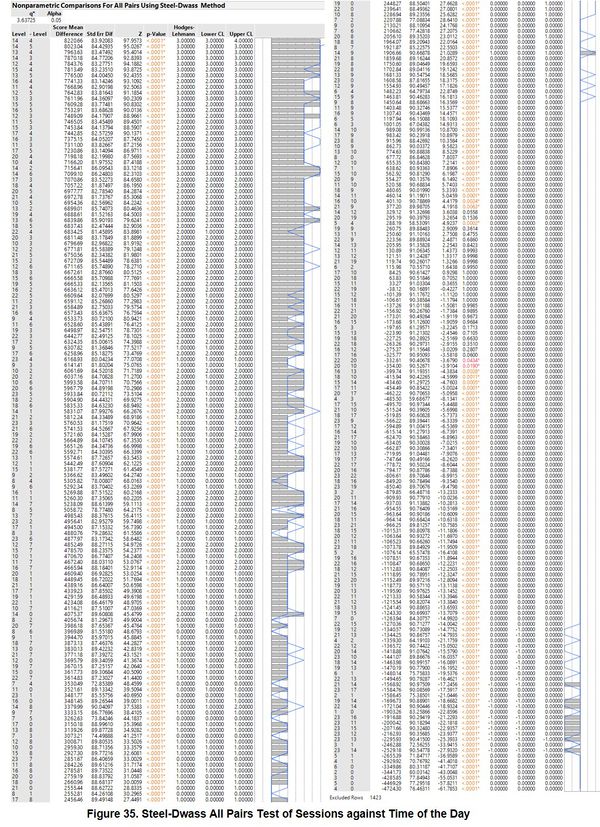
Steel-Dwass method is used instead of Wilcoxon Each Pair to control for overall alpha level [12]. Using the Nonparametric Comparisons for all Pairs using Steel-Dwass Method (Figure 35), which returns p-value for each pair of sessions count by users between any two hours. Most of the hours pairs were found to be significantly different with p-value <0.01.
As the data spans over 6 months, there could be seasonal effect or trends that could affect the usage of the agents, hence the system log could be view in a monthly view to capture any trends or observations. Sessions were tabulated by users_id with months as columns before stacking the columns to conduct analysis on months. 712 outliers were excluded in the analysis.
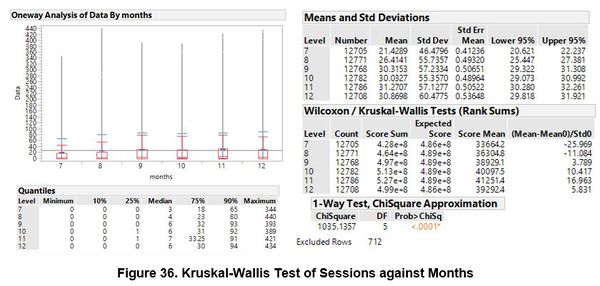
The distribution for each month are found to be highly skewed to the right with the mean to be more than 4 times the median. Using the Kruskai-Wallis Tests (Figure 36), which returns p-value <0.0001*, shows that the sessions count by the users for at least one month is significantly different from another month.
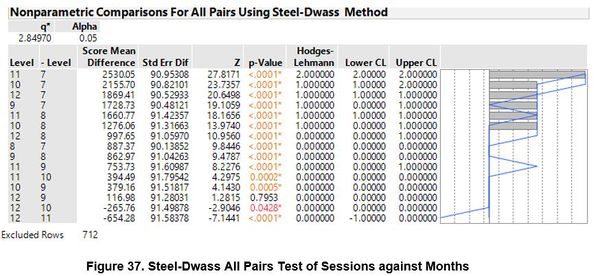
Using the Nonparametric Comparisons for all Pairs using Steel-Dwass Method, which returns p-value for each pair of sessions count by users between two months. With the exceptions of December and September pair, and December and October pair, all the remaining pairs are found to be significantly different.
As a property agent work may not follow the usual 5-days work week, hence the system log could be view from the different day of the week to identify any trends from the users’ usage log. Sessions were tabulated by users_id with day_of_week as columns before stacking the columns to conduct analysis on day_of_week. 661 outliers were excluded in the analysis.
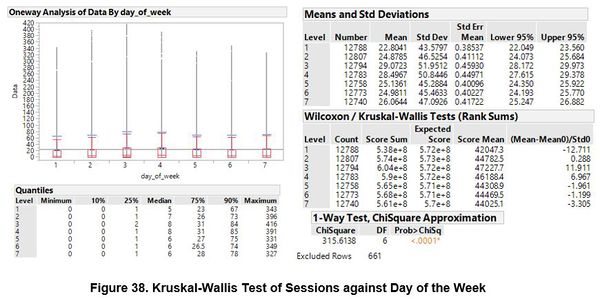
The distribution for each day of week are found to be highly skewed to the right with the mean to be more than 3 times the median. Using the Kruskai-Wallis Tests (Figure 38), which returns p-value <0.0001*, shows that the sessions count by the users for at least one day of week are significantly different from another day of the week.
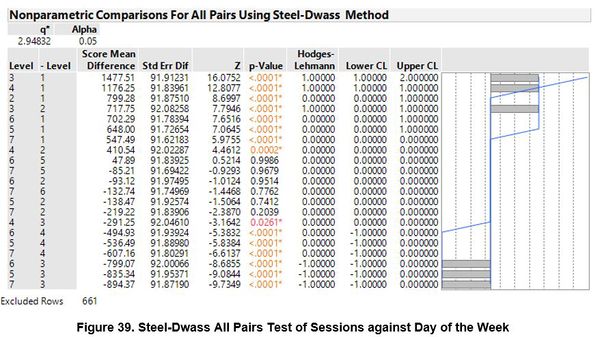
Using the Nonparametric Comparisons for all Pairs using Steel-Dwass Method (Figure 39), which returns p-value for each pair of sessions count by users between any two days of the week. Most pairs were found to be significantly different with p-value <0.01
Listings
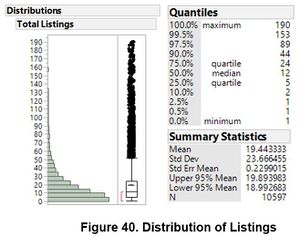
By tabulating the data in the “user_id” view, the distribution can be generated for the number of listings by each user. 177 outliers are excluded. The distribution is skewed to the right with the mean greater than median. The N tabulated here is only about 83% of the users found in Sessions file.
As creating listings is one of the key activities an agent could do to gain more enquiries, this activity is similarly broken down by hours, months, and days of week just like what was done in Sessions. Listings were tabulated by users_id with hours as columns before stacking the columns to conduct analysis on hours. 660 outliers were excluded in the analysis.
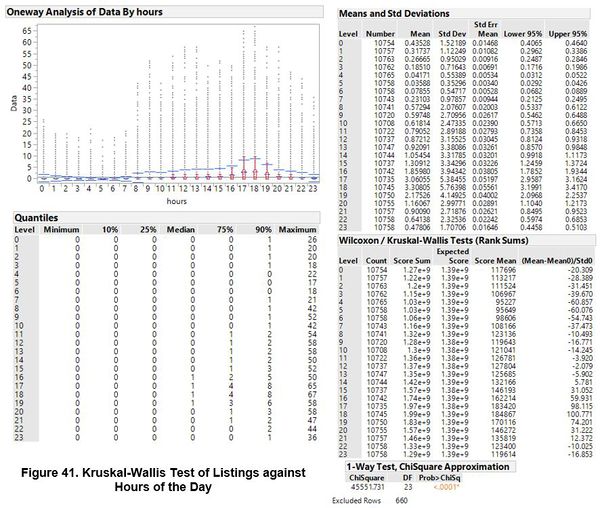
The distribution for each hour are found to be rightly skewed with the mean greater than median. Other than hours 16 to 19, the median of the remaining hours are found to be 0 which implies the low count of listings during most hours. Using the Kruskai-Wallis Tests, which returns p-value <0.0001*, shows that the listings count by the users for at least one hour period is significantly different from another hour period.
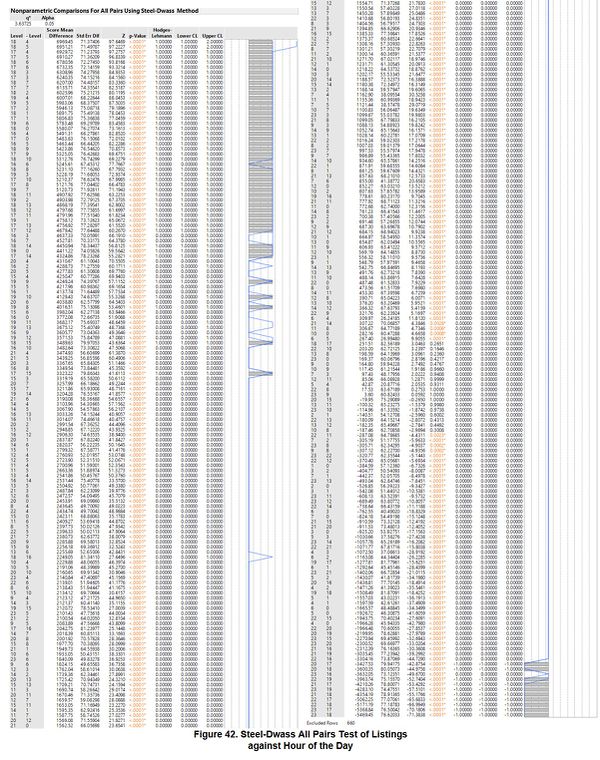
Using the Nonparametric Comparisons for all Pairs using Steel-Dwass Method, which returns p-value for each pair of listing count by users between any two hours. Most pairs were found to be significantly different with p-value <0.01.
Listings were tabulated by users_id with months as columns before stacking the columns to conduct analysis on months. 424 outliers were excluded in the analysis.
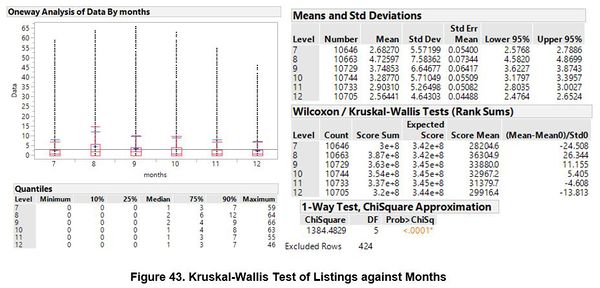
The distribution for each month are found to be rightly skewed with the mean greater than the median. Using the Kruskai-Wallis Tests, which returns p-value <0.0001*, shows that the listings count by the users for at least one month is significantly different from another month.
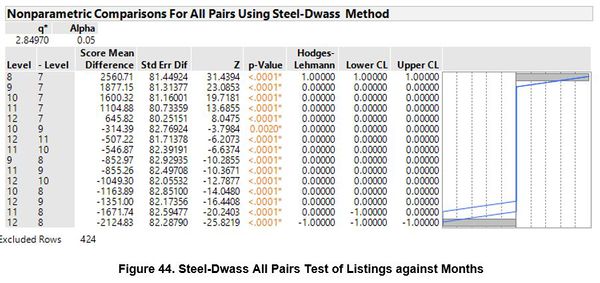
Using the Nonparametric Comparisons for all Pairs using Steel-Dwass Method (see below), which returns p-value for each pair of listing count by users between any two months. All of the pairs were found to be significantly different with p-value <0.01.
Listings were tabulated by users_id with day_of_week as columns before stacking the columns to conduct analysis on day_of_week. 684 outliers were excluded in the analysis.
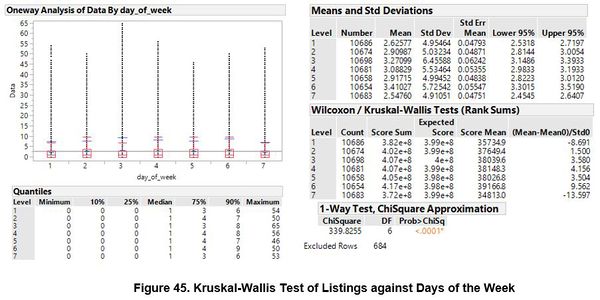
The distribution for each day of week are found to be rightly skewed with the mean greater than median. Using the Kruskai-Wallis Tests, which returns p-value <0.0001*, shows that the listings count by the users for at least one day of week is significantly different from another day of the week.
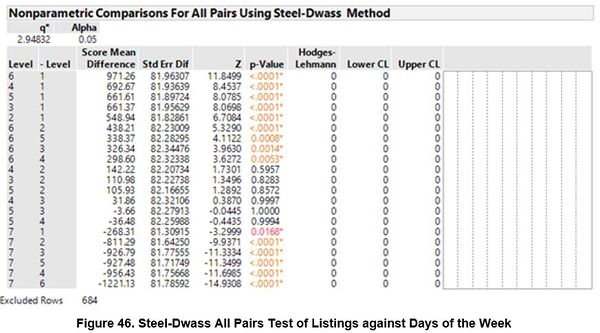
Using the Nonparametric Comparisons for all Pairs using Steel-Dwass Method (see below), which returns p-value for each pair of listing count by users between any two days of the week. Most pairs were found to be significantly different with p-value <0.01.
Listings have 2 source types as stated in the given data file. Agents can either post an organic listing which is original or a synced listing which is transported from an external portal. Listings were tabulated by users_id with source_type as columns before stacking the columns to conduct analysis on source types. 367 outliers were excluded in the analysis.
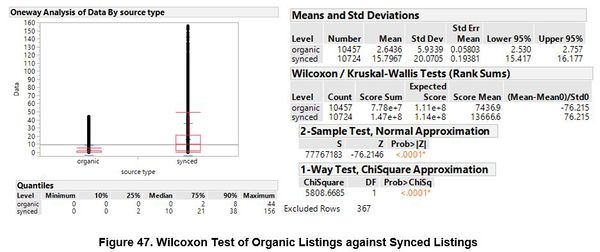
The distribution for each source_type is found to be highly skewed to the right with the mean to be greater than median. Using the Wilcoxon Tests, 2-Sample Test which returns p-value <0.0001*, shows that the listing count by the users for each source type are significantly different. Users have significantly more synced listings than organic listings.
Cobroke
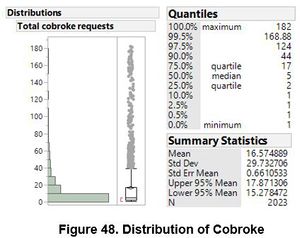
By tabulating the data in the “user_id” view, the distribution can be generated for the number of cobroke requests sent by each user. 67 outliers are excluded. The distribution is skewed to the right with the mean greater than median. The N tabulated here is only about 16% of the users found in Sessions file.
As the user count for Cobroke is only a small percentage of the user count for Sessions, the breakdown of the data into other time series format would not be as meaningful. Furthermore, 99.co also feedback that their cobroke request is a function which has not always been properly utilised. Agents may spam that function as a mean to gain new networks rather than offering potential leads to the other agents.
Enquiries
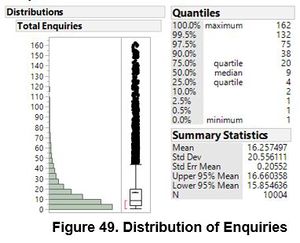
By tabulating the data in the “user_id” view, the distribution can be generated for the number of enquiries received by each user. 101 outliers are excluded. The distribution is skewed to the right with the mean greater than median. The N tabulated here is only about 78% of the users found in Sessions file.
Enquiries received can be either from other agents or from consumers as stated in the given data file column “enquires_type”. Enquiries were tabulated by users_id with enquiries_type as columns before stacking the columns to conduct analysis on source types. 170 outliers were excluded in the analysis.
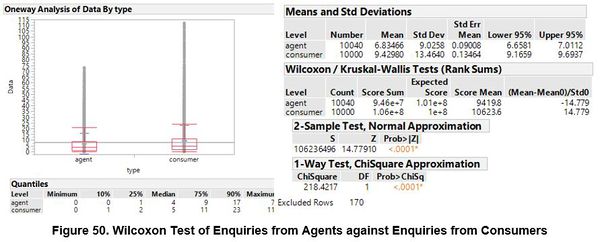
The distribution for each enquire type is found to be rightly skewed with the mean to be greater than median. Using the Wilcoxon Tests, 2-Sample Test which returns p-value <0.0001*, shows that the enquiries received by the users from agents or consumer are significantly different. Users have significantly more enquiries from consumers than agents.
Comparison by Subscription Plan
Based on the subscription model of 99.co, there are 2 available subscription plans for all agents, either free or paid. For a free plan user, they are only entitled to a maximum of 5 listings. As for a paid plan user, they get 100 listings and have their listings featured on the portal. Due to the difference in both the payment and the benefits, it would be crucial to identify any differences in the data between paid and free users.
Sessions by plan
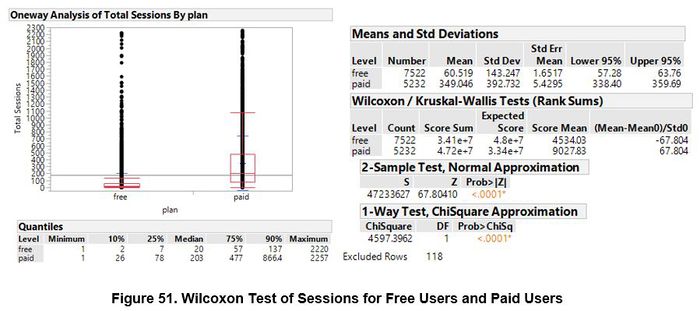
Using the Wilcoxon Tests, 2-Sample Test which returns p-value <0.0001*, shows that the sessions count by the subscription plan of the users are significantly different. It also showed that paid users have significantly more sessions recorded than free users.
Listings types by plan
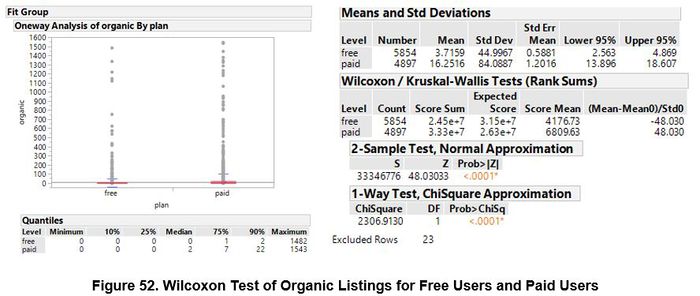
Using the Wilcoxon Tests, 2-Sample Test which returns p-value <0.0001*, shows that the organic listings count by the subscription plan of the users are significantly different. It also showed that paid users have significantly more organic listings than free users
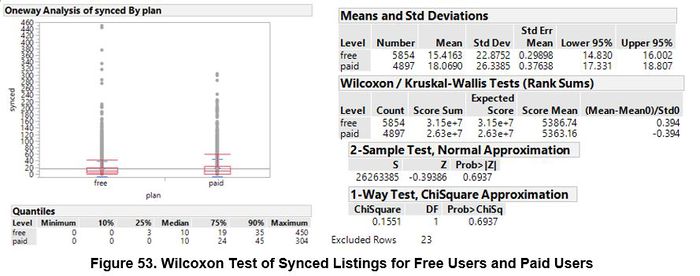
Using the Wilcoxon Tests, 2-Sample Test which returns p-value of 0.69, shows that the synced listings count by the subscription plan of the users are not significantly different.
Cobroke by plan
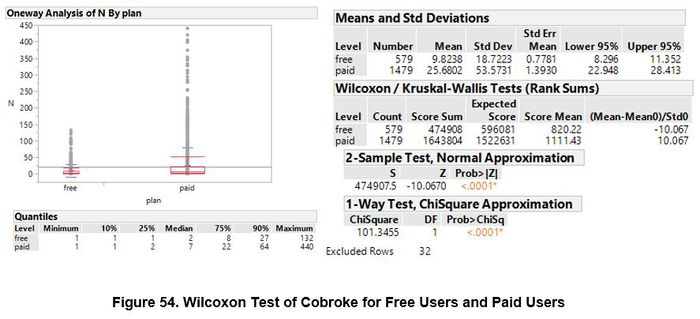
Using the Wilcoxon Tests, 2-Sample Test which returns p-value <0.0001*, shows that the cobroke request count by the subscription plan of the users are significantly different. It also showed that paid users send significantly more cobroke requests than free users
Enquiries types by plan
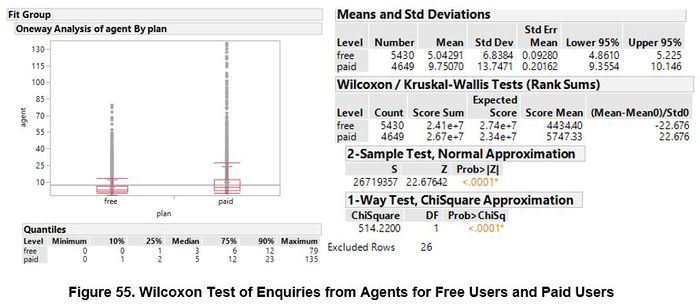
Using the Wilcoxon Tests, 2-Sample Test which returns p-value <0.0001*, shows that the enquiries from agent count by the subscription plan of the users are significantly different. It also showed that paid users received significantly more enquiries from agents than free users
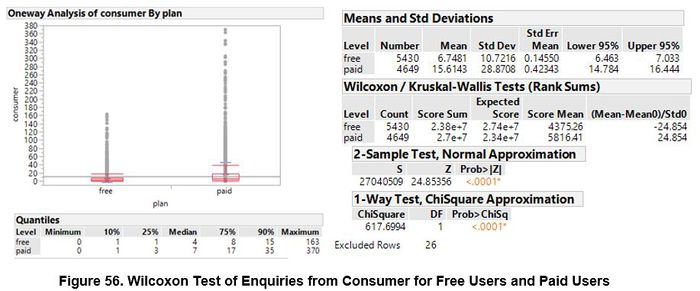
Using the Wilcoxon Tests, 2-Sample Test which returns p-value <0.0001*, shows that the enquiries from consumers count by the subscription plan of the users are significantly different. It also showed that paid users received significantly more enquiries from consumers than free users
The few testes above have shown that paid users generally perform more activities and received more enquiries than the free users. Paid users had incurred a cost for the access of the platform, it is assumed and proven that they will be more committed in using the platform than the free users
Rencency Analysis (December)
As the data spanned over 6 months, all the analysis was done using aggregated data. Through breaking the data down could give a deeper understanding on the usage rate per user per month. December’s data will be used, and it would also be most recent data collected.
Each data files were filter to month with label 12 and were tabulated before merging together. All the missing values indicate that the user did not perform that activity hence were replaced with ‘0’. Users with 0 sessions count on the month of December were filtered out, therefore the following distribution generated will be usage rate of the users who have at least 1 session count on December. After filtering the 0 count sessions as well as the outliers, there are a total of 9570 users.
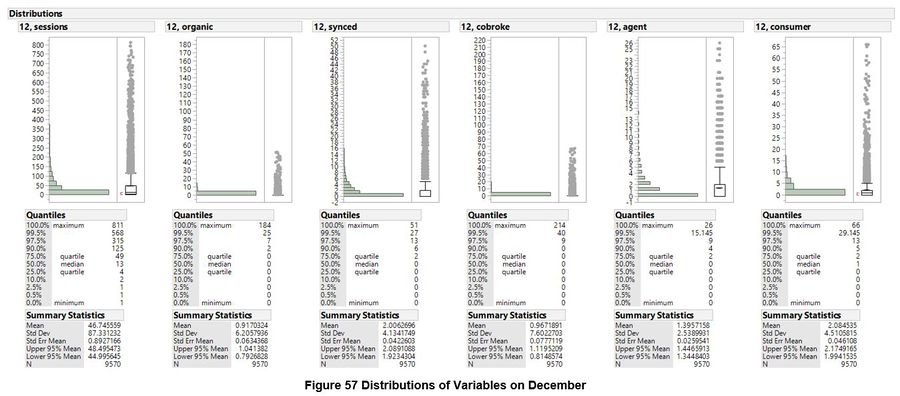
The distributions of each activity are highly skewed and there are a huge percentage of users with 0 counts in other activities recorded. In fact, the median for all other activities are all less than 1. It also implies that among the users who log onto the platform on the month of Decembers, most of them do not perform other activities. This observation suggest that the team may face some difficult when conducting other further analysis – Clustering analysis.