Difference between revisions of "ANLY482 AY2017-18T2 Group32: Project Overview/Methodology"
| (16 intermediate revisions by 2 users not shown) | |||
| Line 1: | Line 1: | ||
| + | <div align="right"> | ||
| + | [[ANLY482_AY2017-18_Term_2|<font color="#dd672e" font-family:helvetica><b>Return to ANLY482 AY2017-18 Home Page</b></font>]] | ||
<center> | <center> | ||
| − | [[File: | + | [[File:Pharma G Logo.png|300px]] |
</center> | </center> | ||
| Line 8: | Line 10: | ||
| style="padding:0.2em; font-size:130%; background-color:#000000; text-align:center; " width="5%" | | | style="padding:0.2em; font-size:130%; background-color:#000000; text-align:center; " width="5%" | | ||
| − | [[ANLY482_AY2017- | + | [[ANLY482_AY2017-18T2_Group_32| <font face ="Avenir Next" color="#ffffff" >Home</font>]] |
| style="background:none;" width="1%" | | | style="background:none;" width="1%" | | ||
| Line 48: | Line 50: | ||
<div style="background: #FFFFFF;border-style:solid; border-top:0px; border-width: 2px; border-color: #000000; padding: 1em; text-align: justify;"> | <div style="background: #FFFFFF;border-style:solid; border-top:0px; border-width: 2px; border-color: #000000; padding: 1em; text-align: justify;"> | ||
| − | Before performing any data analysis, it is critical to perform exploratory data analysis to understand the data better. | + | === Data Cleaning === |
| + | |||
| + | Before performing any data analysis, it is critical to perform exploratory data analysis to understand the data better. Errors such as incomplete and invalid values could lead to inaccurate results. Hence, the data must be cleaned so that it is suitable for any further analysis. The following summarizes the data cleaning process we have taken for each dataset: | ||
| + | |||
| + | ==== HCP ==== | ||
| + | # Removed dummy variables with suspicious looking values in the “postal code” column such as (000001,000002, etc) | ||
| + | [[File:Methedology 1.png | 600px | center]] | ||
| + | |||
| + | |||
| + | ==== HCO ==== | ||
| + | # Removed dummy variables with suspicious looking values in the “postal code” column such as (000001,000002, etc) or Test Accounts. | ||
| + | [[File:Methedology 2.png | 600px | center]] | ||
| + | |||
| + | |||
| + | ==== Invoice Detail ==== | ||
| + | # Filter transactions to obtain TCE products using TCE_Brands sheet | ||
| + | # For negative values in the “sales qty” and “amount$” columns, we kept the values as it is. This is because after checking with our sponsor, these records are products that have been returned back to them, so they served as sales that have been void. Upon aggregation by quarters, no negative values will be present. | ||
| + | # For the missing values in “price$” columns, we imputed their values to “0” as these rows contain records where free samples are given out to the customers. | ||
| + | [[File:Methedology 3.png | 600px | center]] | ||
| + | |||
| + | 4. Using Ctrl-F function to show “search data tables” interface, then enter the following fields: | ||
| + | [[File:Methedology 4.png | 600px | center]] | ||
| + | |||
| + | 5. For 5-digits values in “postal code” column, a new column is created to store the converted ‘postal code’ in 6-digits format, with data type changed from numerical to categorical and formula function used to add the missing ‘0’. | ||
| + | <br> | ||
| + | [[File:Methedology 5.png | 600px | center]] | ||
| + | |||
| + | <br> | ||
| + | === Data Transformation === | ||
| + | With the use of JMP Pro, we explored and joined data sets using common joints to analyze the relationships between different variables across the various data sets. | ||
| + | |||
| + | For instance, we joined HCO data with the Invoice Details using “ZP Account” in HCO and “Customer_code” in Invoice, so that we can analyze the sales for each clinic and observe what products do they often purchase | ||
| + | |||
| + | |||
| + | === Exploratory Data Analysis (EDA) === | ||
| + | We conducted an Exploratory Data Analysis on our final datasets to seek greater insights between sales and healthcare organizations (HCO-Invoice) as well as to understand what products GSK sales representatives are pushing to healthcare practitioners ( HCP-Call_Details). | ||
| + | |||
| + | |||
| + | Sales and Healthcare organizations | ||
| + | [[File:Methedology 6.png | 600px | center]] | ||
| + | |||
| + | GSK appears to have a strong performance in 2016 but sales amount decreased by 9% to a 3-year low in 2017. This signals a need to for GSK to keep their sales team in check using Key Performance Indicators as mentioned above. | ||
| + | |||
| + | [[File:Methedology 7.png | 600px | center]] | ||
| + | |||
| + | This could be attributed to the drop of sales from the general hospitals which generate 42% of GSK’s yearly revenue. GSK saw a decrease in sales revenue from its top 3 buyers other than Changi General Hospital from 2016. | ||
| + | |||
| + | [[File:Methedology 8.png | 600px | center]] | ||
| + | |||
| + | Lastly, GSK’s top three product brought in lesser revenue last year as compared to 2016. Most notably, their best selling drug, Keppra, saw a sharp decrease in sales last year, falling by 8.8%. | ||
| + | |||
| + | ==== Calls and HealthCare Practitioners ==== | ||
| + | |||
| + | Sales Representatives of GSK tend to call the doctors and nurses in each organization and try to sell a new product or convince them to buy another batch of an existing drug in their inventory. The following EDA will allow us to have a better understanding on how we can gauge the effectiveness of the sales’ team and their call list. | ||
| + | |||
| + | [[File:Methedology 9.png | 600px | center]] | ||
| + | [[File:Methedology 10.png | 600px | center]] | ||
| + | |||
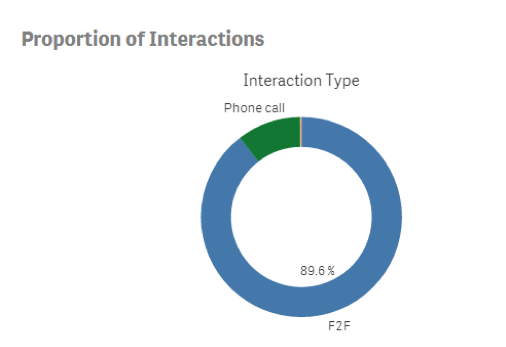
| + | 89.6% of all interactions are face to face, which explains why interaction duration can go as high as >300 minutes as Sales Representatives may need more time to build rapport. In addition, there seems to be correlation between the number of products pushed to the practitioner and the interaction duration. For a huge client like NUS Hospital, the representative may need to push for several product lines whereas a small clinic will only need a fraction of it. | ||
| − | |||
</div> | </div> | ||
| + | |||
<br> | <br> | ||
| + | |||
| + | <!-- Start of Softwares Used Content --> | ||
| + | |||
| + | <div align="left"> | ||
| + | <div style="background: #f6a228; padding: 12px; font-family: Avenir Next; font-size: 18px; font-weight: bold; line-height: 1em;"><font color="#ffffff">Softwares Used</font> | ||
| + | </div> | ||
| + | <div style="background: #FFFFFF;border-style:solid; border-top:0px; border-width: 2px; border-color: #000000; padding: 1em; text-align: justify;"> | ||
| + | <div style="padding-left:70px; text-align: left; width:980px;"> | ||
| + | <b>Exploratory:</b> | ||
| + | Excel & Tableau | ||
| + | |||
| + | <b>In-depth Analysis:</b> | ||
| + | JMP Pro & R | ||
| + | |||
| + | <b>Visualization:</b> | ||
| + | Qlik Sense | ||
| + | </div> | ||
| + | |||
| + | <!--- End Softwares Content --> | ||
Latest revision as of 00:02, 16 April 2018
Return to ANLY482 AY2017-18 Home Page
| Description | Data | Methodology |
Contents
Data Cleaning
Before performing any data analysis, it is critical to perform exploratory data analysis to understand the data better. Errors such as incomplete and invalid values could lead to inaccurate results. Hence, the data must be cleaned so that it is suitable for any further analysis. The following summarizes the data cleaning process we have taken for each dataset:
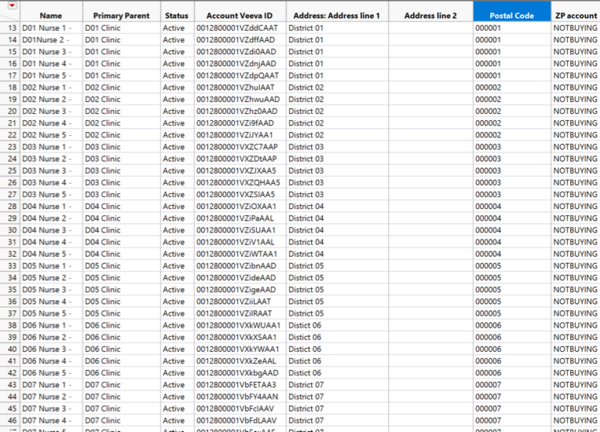
HCP
- Removed dummy variables with suspicious looking values in the “postal code” column such as (000001,000002, etc)
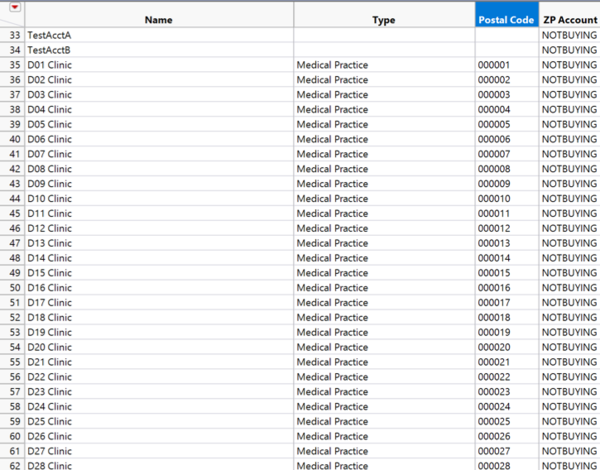
HCO
- Removed dummy variables with suspicious looking values in the “postal code” column such as (000001,000002, etc) or Test Accounts.
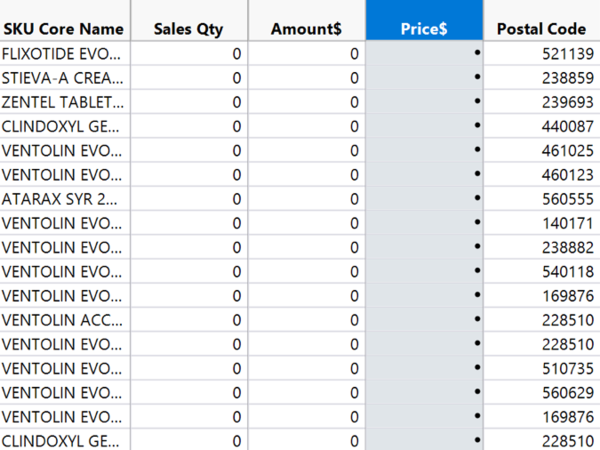
Invoice Detail
- Filter transactions to obtain TCE products using TCE_Brands sheet
- For negative values in the “sales qty” and “amount$” columns, we kept the values as it is. This is because after checking with our sponsor, these records are products that have been returned back to them, so they served as sales that have been void. Upon aggregation by quarters, no negative values will be present.
- For the missing values in “price$” columns, we imputed their values to “0” as these rows contain records where free samples are given out to the customers.
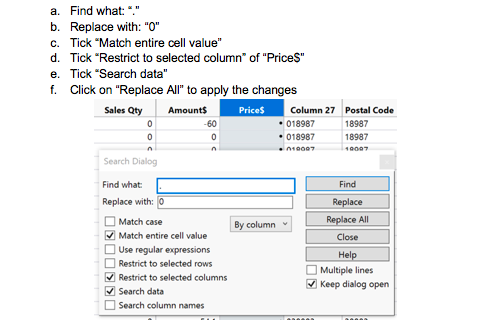
4. Using Ctrl-F function to show “search data tables” interface, then enter the following fields:
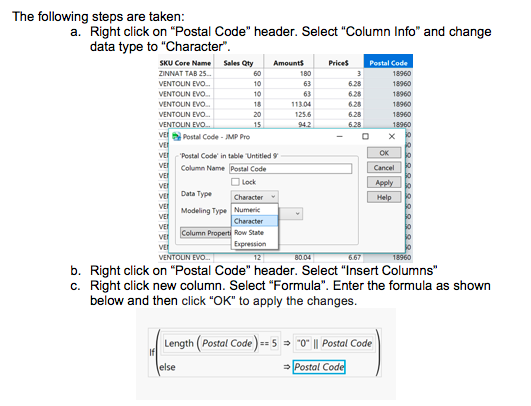
5. For 5-digits values in “postal code” column, a new column is created to store the converted ‘postal code’ in 6-digits format, with data type changed from numerical to categorical and formula function used to add the missing ‘0’.
Data Transformation
With the use of JMP Pro, we explored and joined data sets using common joints to analyze the relationships between different variables across the various data sets.
For instance, we joined HCO data with the Invoice Details using “ZP Account” in HCO and “Customer_code” in Invoice, so that we can analyze the sales for each clinic and observe what products do they often purchase
Exploratory Data Analysis (EDA)
We conducted an Exploratory Data Analysis on our final datasets to seek greater insights between sales and healthcare organizations (HCO-Invoice) as well as to understand what products GSK sales representatives are pushing to healthcare practitioners ( HCP-Call_Details).
Sales and Healthcare organizations
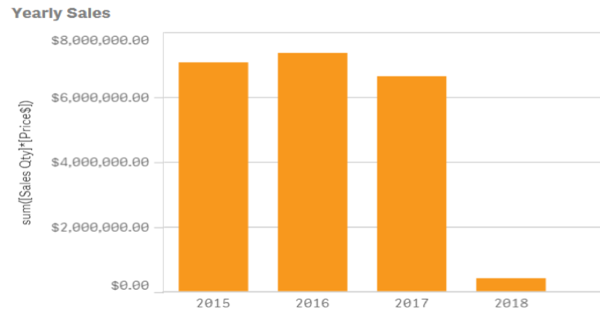
GSK appears to have a strong performance in 2016 but sales amount decreased by 9% to a 3-year low in 2017. This signals a need to for GSK to keep their sales team in check using Key Performance Indicators as mentioned above.
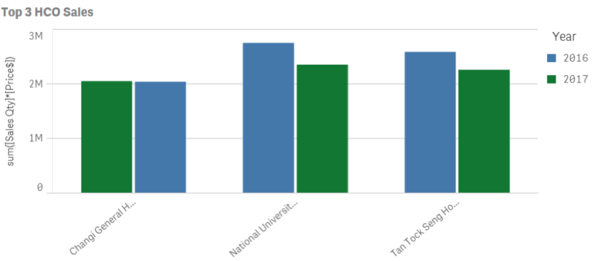
This could be attributed to the drop of sales from the general hospitals which generate 42% of GSK’s yearly revenue. GSK saw a decrease in sales revenue from its top 3 buyers other than Changi General Hospital from 2016.
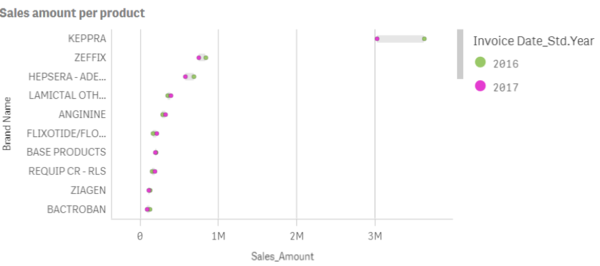
Lastly, GSK’s top three product brought in lesser revenue last year as compared to 2016. Most notably, their best selling drug, Keppra, saw a sharp decrease in sales last year, falling by 8.8%.
Calls and HealthCare Practitioners
Sales Representatives of GSK tend to call the doctors and nurses in each organization and try to sell a new product or convince them to buy another batch of an existing drug in their inventory. The following EDA will allow us to have a better understanding on how we can gauge the effectiveness of the sales’ team and their call list.
89.6% of all interactions are face to face, which explains why interaction duration can go as high as >300 minutes as Sales Representatives may need more time to build rapport. In addition, there seems to be correlation between the number of products pushed to the practitioner and the interaction duration. For a huge client like NUS Hospital, the representative may need to push for several product lines whereas a small clinic will only need a fraction of it.
Exploratory: Excel & Tableau
In-depth Analysis: JMP Pro & R
Visualization: Qlik Sense

