Difference between revisions of "G7 Exploratory Analysis"
| (8 intermediate revisions by the same user not shown) | |||
| Line 9: | Line 9: | ||
| style="padding:0.3em; font-size:100%; background-color:#212121; border-bottom:0px solid #3D9DD7; text-align:center; color:#F5F5F5" width="10%" | | | style="padding:0.3em; font-size:100%; background-color:#212121; border-bottom:0px solid #3D9DD7; text-align:center; color:#F5F5F5" width="10%" | | ||
| − | [[ | + | [[G7 Project Overview | <font color="#00C6BB" size=2><font face= "Century Gothic"><b>PROJECT OVERVIEW</b></font>]] |
| style="border-bottom:0px solid #3D9DD7; background:none;" width="1%" | | | style="border-bottom:0px solid #3D9DD7; background:none;" width="1%" | | ||
| style="padding:0.3em; font-size:100%; background-color:#212121; border-bottom:0px solid #3D9DD7; text-align:center; color:#F5F5F5" width="12%" | | | style="padding:0.3em; font-size:100%; background-color:#212121; border-bottom:0px solid #3D9DD7; text-align:center; color:#F5F5F5" width="12%" | | ||
| − | [[ | + | [[G7 Findings |<font color="#6FEBAO" size=2><font face= "Century Gothic"><b>ANALYSIS & FINDINGS</b></font>]] |
| style="border-bottom:0px solid #3D9DD7; background:none;" width="1%" | | | style="border-bottom:0px solid #3D9DD7; background:none;" width="1%" | | ||
| style="padding:0.3em; font-size:100%; background-color:#212121; border-bottom:0px solid #3D9DD7; text-align:center; color:#F5F5F5" width="12%" | | | style="padding:0.3em; font-size:100%; background-color:#212121; border-bottom:0px solid #3D9DD7; text-align:center; color:#F5F5F5" width="12%" | | ||
| − | [[ | + | [[G7 Project Management|<font color="#00C6BB" size=2><font face= "Century Gothic"><b>PROJECT MANAGEMENT</b></font>]] |
| style="border-bottom:0px solid #3D9DD7; background:none;" width="1%" | | | style="border-bottom:0px solid #3D9DD7; background:none;" width="1%" | | ||
| style="padding:0.3em; font-size:100%; background-color:#212121; border-bottom:0px solid #3D9DD7; text-align:center; color:#F5F5F5" width="10%" | | | style="padding:0.3em; font-size:100%; background-color:#212121; border-bottom:0px solid #3D9DD7; text-align:center; color:#F5F5F5" width="10%" | | ||
| − | [[ | + | [[G7 About Us |<font color="#00C6BB" size=2><font face= "Century Gothic"><b>ABOUT US</b></font>]] |
| style="border-bottom:0px solid #3D9DD7; background:none;" width="1%" | | | style="border-bottom:0px solid #3D9DD7; background:none;" width="1%" | | ||
| Line 36: | Line 36: | ||
{| style="background-color:white; color:white padding: 5px 0 0 0;" width="100%" height=50px cellspacing="0" cellpadding="0" valign="top" border="0" | | {| style="background-color:white; color:white padding: 5px 0 0 0;" width="100%" height=50px cellspacing="0" cellpadding="0" valign="top" border="0" | | ||
| − | | style="vertical-align:top;width:15%;" | <div style="padding: 3px; font-weight: bold; text-align:center; line-height: wrap_content; font-size:16px; font-family:helvetica"> [[ | + | | style="vertical-align:top;width:15%;" | <div style="padding: 3px; font-weight: bold; text-align:center; line-height: wrap_content; font-size:16px; font-family:helvetica"> [[G7 Findings| <b><font color="#212121">Data Cleaning</font></b>]] |
| − | | style="vertical-align:top;width:15%;" | <div style="padding: 3px; font-weight: bold; text-align:center; line-height: wrap_content; font-size:16px; border-bottom:1px solid #3D9DD7; font-family:helvetica"> [[ | + | | style="vertical-align:top;width:15%;" | <div style="padding: 3px; font-weight: bold; text-align:center; line-height: wrap_content; font-size:16px; border-bottom:1px solid #3D9DD7; font-family:helvetica"> [[G7_Exploratory Analysis | <b><font color="#212121">Exploratory Analysis</font></b>]] |
| − | | style="vertical-align:top;width:15%;" | <div style="padding: 3px; font-weight: bold; text-align:center; line-height: wrap_content; font-size:16px; font-family:helvetica"> [[ | + | | style="vertical-align:top;width:15%;" | <div style="padding: 3px; font-weight: bold; text-align:center; line-height: wrap_content; font-size:16px; font-family:helvetica"> [[G7 Confirmatory Analysis | <b><font color="#212121">Confirmatory Analysis</font></b>]] |
| + | |||
| + | | style="vertical-align:top;width:15%;" | <div style="padding: 3px; font-weight: bold; text-align:center; line-height: wrap_content; font-size:16px; font-family:helvetica"> [[G7 Dashboard | <b><font color="#212121">Final Dashboard</font></b>]] | ||
|} | |} | ||
<!--Sub Header End--> | <!--Sub Header End--> | ||
| − | [[Image: | + | <font color = "#ED515C" face= "Century Gothic" size=16px> |
| + | Business Unit Exploration | ||
| + | </font> | ||
| + | <br> | ||
| + | [[Image:DHL_BUs.png|center|1300x320px]] | ||
| + | <font color="#212121" face= "Franklin Gothic Book" size=4px> | ||
| + | We wanted to identify the major Business Units in our dataset. BU 4 was the top business unit in terms of number of shipments for the years 2015 & 2016 and ranked second in 2017 accounting for 43.02% of the total shipments in the data. BU 2 ranked second for the years 2015 & 2016 and ranked first for the year 2017 accounting for 28.33% of the total shipments in the data. | ||
| + | </font> | ||
| + | <br> | ||
| + | <font color = "#ED515C" face= "Century Gothic" size=16px> | ||
| + | Current Operational Performance | ||
| + | </font> | ||
| + | [[Image:DHL_Status.png|center]] | ||
| + | <font color="#212121" face= "Franklin Gothic Book" size=4px> | ||
| + | Next, we wanted to get a glimpse of the current operational performance across the 3 years. The following table shows that 40% of the shipments were delayed in our dataset and the performance does not vary much across the 3 years. | ||
| + | </font> | ||
| + | <br> | ||
| + | <font color = "#ED515C" face= "Century Gothic" size=16px> | ||
| + | Operational Performance/BUs | ||
| + | </font> | ||
| + | [[Image:DHL_BUStatus.png|center|1300x320px]] | ||
| + | <font color="#212121" face= "Franklin Gothic Book" size=4px> | ||
| + | Next, we wanted to check the difference in the operational performance across different business units. The above chart does show a very different performance for different Business units but we will have to conduct statistical tests to confirm our hypothesis which is further covered under the Confirmatory Analysis section. | ||
| + | </font> | ||
| + | <br> | ||
| + | <font color = "#ED515C" face= "Century Gothic" size= 16px> | ||
| + | Operational Performance/Flight Types | ||
| + | </font> | ||
| + | [[Image:DHL_TypeStatus.png|center|1300x320px]] | ||
| + | <font color="#212121" face= "Franklin Gothic Book" size=4px> | ||
| + | We can see from the graph above that the passenger flights perform slightly better than cargo flights but the difference is very small so we will need to test if it is statistically significant or not. | ||
| + | </font> | ||
| + | <br> | ||
| + | <font color = "#ED515C" face= "Century Gothic" size= 16px> | ||
| + | Distribution of Delay Days | ||
| + | </font> | ||
| + | [[Image:DHL_DelayDays.png|center|1300x320px]] | ||
| + | <font color="#212121" face= "Franklin Gothic Book" size=4px> | ||
| + | We also wanted to see by how many days were the above shipments delayed. We found 1 outlier value of 364 days which we removed. The above chart shows the descriptive statistics for the distribution of delayed days. Since the mean and the median values were quite different so we decided to check for skewness and plotted a histogram. | ||
| + | </font> | ||
| + | [[Image:DHL_DelayDays2.png|center|1300x320px]] | ||
| + | <font color="#212121" face= "Franklin Gothic Book" size=4px> | ||
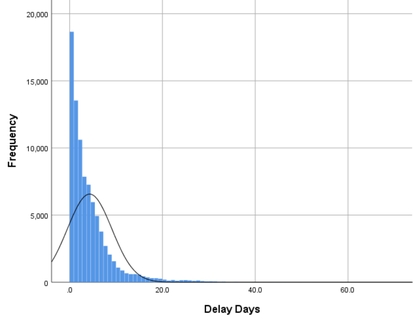
| + | The histogram shows that the delay days are heavily skewed with a long right tail (skew = +2.77) as expected so we cannot conduct parametric statistical tests using this distribution and we will use median instead of mean as our point estimator. | ||
| + | </font> | ||
Latest revision as of 18:11, 15 April 2018
Business Unit Exploration
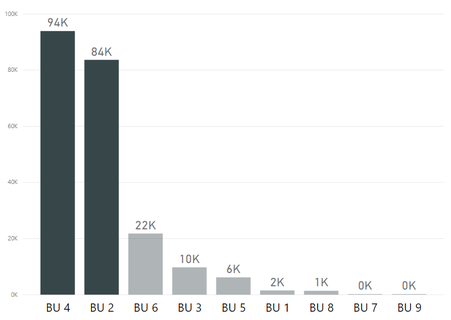
We wanted to identify the major Business Units in our dataset. BU 4 was the top business unit in terms of number of shipments for the years 2015 & 2016 and ranked second in 2017 accounting for 43.02% of the total shipments in the data. BU 2 ranked second for the years 2015 & 2016 and ranked first for the year 2017 accounting for 28.33% of the total shipments in the data.
Current Operational Performance
Next, we wanted to get a glimpse of the current operational performance across the 3 years. The following table shows that 40% of the shipments were delayed in our dataset and the performance does not vary much across the 3 years.
Operational Performance/BUs
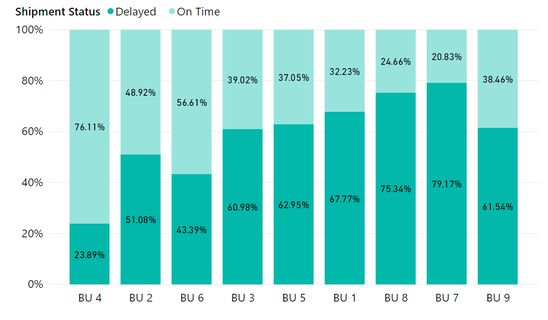
Next, we wanted to check the difference in the operational performance across different business units. The above chart does show a very different performance for different Business units but we will have to conduct statistical tests to confirm our hypothesis which is further covered under the Confirmatory Analysis section.
Operational Performance/Flight Types
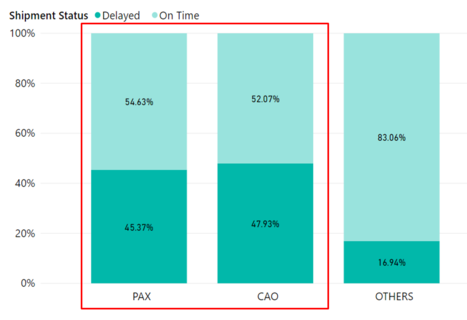
We can see from the graph above that the passenger flights perform slightly better than cargo flights but the difference is very small so we will need to test if it is statistically significant or not.
Distribution of Delay Days
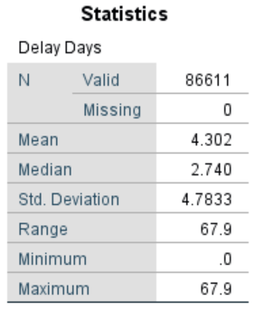
We also wanted to see by how many days were the above shipments delayed. We found 1 outlier value of 364 days which we removed. The above chart shows the descriptive statistics for the distribution of delayed days. Since the mean and the median values were quite different so we decided to check for skewness and plotted a histogram.
The histogram shows that the delay days are heavily skewed with a long right tail (skew = +2.77) as expected so we cannot conduct parametric statistical tests using this distribution and we will use median instead of mean as our point estimator.

