Difference between revisions of "ANLY482 AY2017-18 Group9: Project Overview/ Methodology"
(editted EDA) |
(edit data clean) |
||
| Line 79: | Line 79: | ||
==<div style="background: #40403E; line-height: 0.3em; font-family:helvetica; border-left: #FFA500 solid 15px;"><div style="border-left: #FFFFFF solid 5px; padding:15px;font-size:15px;"><font color= "#F2F1EF"><strong>DATA CLEANING</strong></font></div></div>== | ==<div style="background: #40403E; line-height: 0.3em; font-family:helvetica; border-left: #FFA500 solid 15px;"><div style="border-left: #FFFFFF solid 5px; padding:15px;font-size:15px;"><font color= "#F2F1EF"><strong>DATA CLEANING</strong></font></div></div>== | ||
| − | + | Our group have identified a number of redundant columns in Delivery Data which were deemed not important in our analysis, and have subsequently removed it. <br> | |
| + | These columns are Time (The time where the order is being placed by the staff) and Type (The different type of order being placed).<br><br> | ||
| + | Next, there were presence of several overseas and closed branches in the delivery data as well, such as KOI TE (Thailand), Cambodia Karanak KOI Café, Jakarta Koi, KOI Myanmar, Vietnam and closed outlets which include Espalande, close date of May 2017, and these were deemed as data noises. In addition to removing these data,we removed year 2015 and 2018 data as well, as our analysis on 2 years analysis - 2016 and 2017. | ||
<br> | <br> | ||
<!-- | <!-- | ||
| Line 87: | Line 89: | ||
<br> | <br> | ||
--> | --> | ||
| + | |||
==<div style="background: #40403E; line-height: 0.3em; font-family:helvetica; border-left: #FFA500 solid 15px;"><div style="border-left: #FFFFFF solid 5px; padding:15px;font-size:15px;"><font color= "#F2F1EF"><strong>MODEL SELECTION</strong></font></div></div>== | ==<div style="background: #40403E; line-height: 0.3em; font-family:helvetica; border-left: #FFA500 solid 15px;"><div style="border-left: #FFFFFF solid 5px; padding:15px;font-size:15px;"><font color= "#F2F1EF"><strong>MODEL SELECTION</strong></font></div></div>== | ||
Next, seasonality analysis will be carry out to determine the optimal restock amount for each day by utilizing the past data. We will be utilizing Quantitative Forecasting Analysis to help identify optimal restock amount. This forecasting approach involves the use of historical data to predict future demand for goods. However, it is notable that the more data is available, the more accurate picture of historical demand will be attained. Furthermore, though this model provides a basis of forecasting, demand could be affected by seasonality. Henceforth, our team are considering two Time Series Analysis Models Naive Approach and Seasonal Naive Approach. In our opinion, Seasonal Naive Approach is a more appropriate model for our analysis, however due to the limited data provided, our team are considering the more generic Naive Approach too for our data analysis to ensure that we take into account the full picture available. | Next, seasonality analysis will be carry out to determine the optimal restock amount for each day by utilizing the past data. We will be utilizing Quantitative Forecasting Analysis to help identify optimal restock amount. This forecasting approach involves the use of historical data to predict future demand for goods. However, it is notable that the more data is available, the more accurate picture of historical demand will be attained. Furthermore, though this model provides a basis of forecasting, demand could be affected by seasonality. Henceforth, our team are considering two Time Series Analysis Models Naive Approach and Seasonal Naive Approach. In our opinion, Seasonal Naive Approach is a more appropriate model for our analysis, however due to the limited data provided, our team are considering the more generic Naive Approach too for our data analysis to ensure that we take into account the full picture available. | ||
Revision as of 16:45, 25 February 2018
Contents
DATA COLLECTION / PREPARATION
Upon understanding the problems faced by KOI and coming up with potential solution for their problems, we requested a list of datasets that we will required to perform our analysis. In particular, we will target sales and wastage data to optimize the reorder inventory.
To facilitate our analysis, KOI has kindly provided our team with a data of 47 outlets with 1-2 years (from Jan 2016 - Dec 2017) worth of data collected. The client wish to focus on the latest business fiscal year, henceforth we will be provided with the latest data obtained. The type of data obtained are summarize in the table below.
Data Summary
Delivery Data
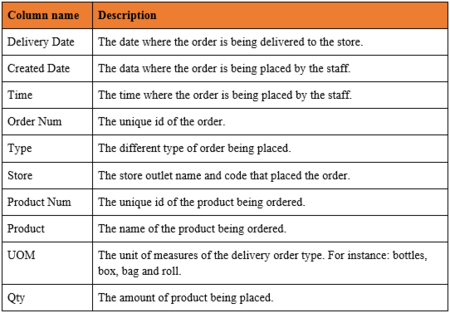
A row in this table represents a specific delivery ordered by a branch. The detailed description of the main columns in this table are as follow:
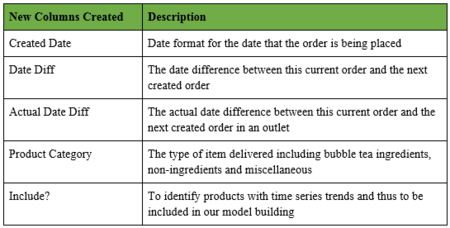
Additional columns have also been created to aid us in our analysis as follow:
Promotion Data
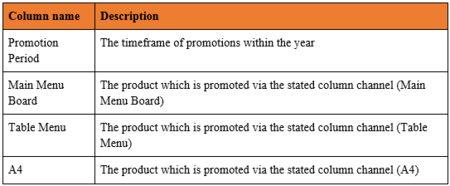
A row in this table represent a specific promotional campaign held in a period. The detailed description of the main columns in this table are as follow:
Outlet Data
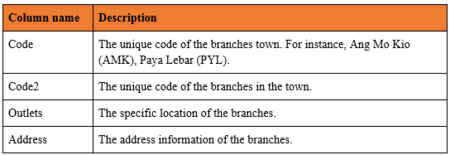
A row in this table represents the KOI branch outlet information. The detailed description of the main columns in this table are as follow:
EXPLORATORY DATA ANALYSIS
Our main project aim is to optimize inventory reorder point with a 15-20% safety net surplus. Utilising EDA, we will identify differences between orders from 2016 and 2017, taking into factors such as launch of new outlets. Additionally, we will analyze reordering frequency per outlets to identify outlets with the most reorders in terms of quantity and number of orders. Henceforth, we would perform a cluster analysis on products with similar trends as well as be able to provide a business recommendation on outlets with similar reordering frequncy in similar regions.
DATA CLEANING
Our group have identified a number of redundant columns in Delivery Data which were deemed not important in our analysis, and have subsequently removed it.
These columns are Time (The time where the order is being placed by the staff) and Type (The different type of order being placed).
Next, there were presence of several overseas and closed branches in the delivery data as well, such as KOI TE (Thailand), Cambodia Karanak KOI Café, Jakarta Koi, KOI Myanmar, Vietnam and closed outlets which include Espalande, close date of May 2017, and these were deemed as data noises. In addition to removing these data,we removed year 2015 and 2018 data as well, as our analysis on 2 years analysis - 2016 and 2017.
MODEL SELECTION
Next, seasonality analysis will be carry out to determine the optimal restock amount for each day by utilizing the past data. We will be utilizing Quantitative Forecasting Analysis to help identify optimal restock amount. This forecasting approach involves the use of historical data to predict future demand for goods. However, it is notable that the more data is available, the more accurate picture of historical demand will be attained. Furthermore, though this model provides a basis of forecasting, demand could be affected by seasonality. Henceforth, our team are considering two Time Series Analysis Models Naive Approach and Seasonal Naive Approach. In our opinion, Seasonal Naive Approach is a more appropriate model for our analysis, however due to the limited data provided, our team are considering the more generic Naive Approach too for our data analysis to ensure that we take into account the full picture available.
MODEL VALIDATION
To validate our model, we will be separating our data into two different set. 70% of the data will be used as our training data set and 30% of the data will be our test data to validate our model. Upon validating our model, we will modify our model and validate it again. This process will repeat until we are satisfied with the performance of our model.


